 Skip to main content
This article describes the story of an experiment whose main goal was to perform the Windows OS debugging using the USB bus. First of all, information in this article will be interesting for the developers of drivers and Windows OS low level components functioning in the kernel mode. Also, this article can be interesting for engineers and analysts that develop devices, which interact with Windows OS, those, who have a need in USB debugging BIOS, and everybody who is just interested in how to USB debug Windows.
Contents:
Evolution of Debug Modes
In this part of the article, I will give a short description of how the tools and methods of the Windows debug modes evolved together with the development of software and hardware.
Host + COM + Target
Formerly, the host machine + target machine pair was used for debugging of drivers or Windows OS components. Both computers were connected with the null modem cable via the serial port. Then, on one of the machines (host machine), the Win debugger application started and, on another machine (target machine), the driver or OS component to be debugged started. The main shortcoming was the low speed of data transfer that, in its turn, influenced the debugging speed significantly.
Host + FireWire + Target
After the appearance of the firewire interface, the data transfer speed increased notably. This made the debugging process more pleasant and, at the same time, caused one serious problem. The support of this mode appeared starting from the Windows XP OS.
The motherboard of one of the machines may not have the built-in fireware interface. This problem can be easily solved for the PC by installing the additional PCI expansion card, which carries one or many additional interfaces (COM, firewire, USB). Concerning the portable devices, such as laptops, installation of the expansion card does not always help to perform the debug mode via the additional interfaces.
One should also remember that the installation of expansion cards is not always possible.
Host + USB + Target
Today, the USB interface is the most popular among the data transfer interfaces as it combines the high speed and simplicity of usage. There was no support for debugging via USB interface in Windows OS 2000 – 2003. Such support appeared starting from Windows Vista OS and can be also used for USB debugging Windows 7/8.
There is a sequence of rules and tips that should be performed before the debugging mechanism via USB bus is operable. The most important is that the USB interface is present practically on all devices where Windows Vista OS or later versions of this family can be installed. This, in its turn, increases the chance that when the hard-to-detect bug appears, we will be able to use modern debugging facilities for its removal.
Next, I will describe a number of rules and tips that will help you to perform the debugging via the USB bus.
Preparation Steps for Windows OS Debugging Using USB Bus
In this part of the article, there are 7 steps and several tips of how to perform the Windows OS debugging using the USB bus.
Step 1: Buy or borrow a special device for USB debugging
You need to use a special USB 2.0 debug cable device to perform the Host Machine + USB + Target Machine debugging mechanism. This cable is not a standard USB 2.0 cable, because it has an extra hardware component that makes it compatible with the USB2 Debug Device Functional Specification. You can find these cables with an Internet search for “USB 2.0 debug cable”.
In the current experiment, I used the NET20DC device produced by Ajays company that is displayed on Figure 1.
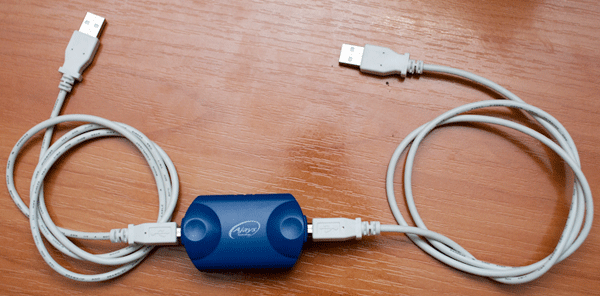
Fig. 1 – Ajays Device for Debug
You can use another similar device.
Step 2: Install the WinDbg debugger
Install the WinDbg debugger on the host machine (the WinDbg debugger version must be not lower than 6.5.3.8). WinDbg is a free Win debugger distributed by the Microsoft company. Formerly, it was supplied separately and now it is included in the Windows Driver Kit (WDK) package.
In the Links section of the article, the references to the manufacturer web site, where WinDbg is available for downloading, are specified.
Step 3: Install the drivers for USB 2.0 Debug Cable device on the host
For the further work with the Ajays device, you should install the driver for this device on the host machine. The driver has the usb2dbg.sys name, it is supplied together with WinDbg, and is located in the application folder (.\usb\usb2dbg.sys).
You should find two free USB ports on the host machine and plug in both sockets of the Ajays NET20DC device. Actions, mentioned above, are described on Figure 2.
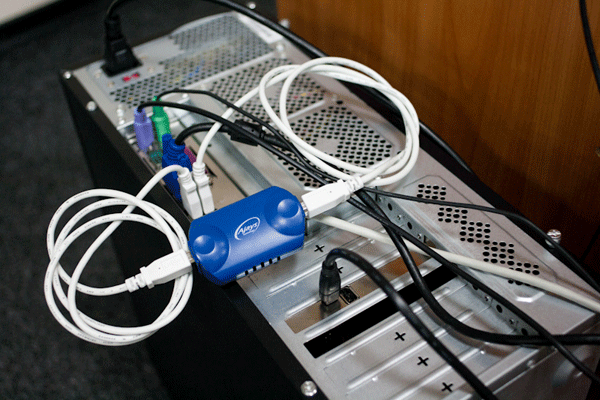
Fig.2 – Plugging the Ajays device for the driver installation
Use the New Hardware Installation Wizard and perform the driver installation from the WinDbg folder.
Step 4: Create the Boot Entry for the Debug Mode
Now, let’s turn to the target machine, which will serve as the debugged unit. Let’s create a debug boot record using the bcdedit utility, which is the manager of boot records in Windows Vista/7 OS. To do this, we need the following:
- Start the cmd.exe console and enter the following command:
C:\>bcdedit /copy {current} /d "Debug"- The configuration of the Debug boot record will be performed from the GUI console. To start the GUI console, enter the following command: C:\>msconfig
- In the System Configuration console window, select the Boot tab.
- Select the Debug boot record and select the Advanced Options menu.
- Define options for the debugging via USB device as shown on Figure 3.
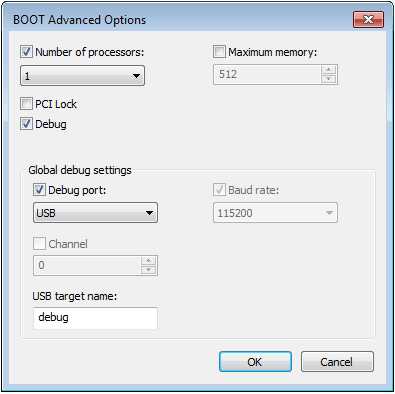
Fig.3 – Debug Mode configuration for USB debugging
On the figure above, pay attention to the USB target name field that has the debug value. This field serves as the name of the session for the debugging.
Step 5: Disable BIOS Legacy USB Support option
On the target machine, disable the Legacy USB Support option in BIOS. It is important to force BIOS not to call the USB ports, thereby it does not influence the debugging process badly. Otherwise, the debugging process will be impossible.
It is also worth mentioning that any USB compatible devices (including USB keyboard) will not function before the OS start.
Disabling of the Legacy USB Support option for AMI BIOS v.02.61 is displayed on Figure 4.
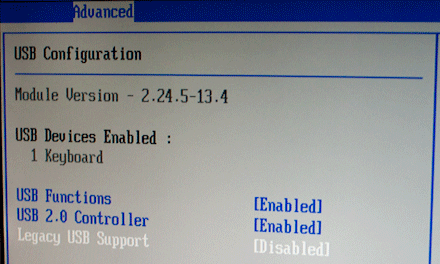
Fig. 4 – Disabling the Legacy USB Support option
Step 6: Detect the first USB port
To perform the debugging via the USB bus, the Ajays device output ports must be connected to the USB port 1. This rule concerns the host machine.
To define the USB port 1, there is a special USB View utility produced by Microsoft. You can find it by yourself or see the Links section of the article.
To define the USB port 1, you will have to check all ports sequentially by inserting the Ajays NET20DC device in each of them and checking the program reports.
Restrictions:
- It should be mentioned that if the USB port 1 is not found, it is likely that it is not put out on your computer.
- The USB port controller should support the debug mode. Usually, this option is present even in the cheapest USB controller models. That is why you should not worry about it.
- USB debugging does not work over a hub or docking station.
The general view of the USB View program where the Ajays device is connected to the USB port 1 is displayed below on Figure 5.
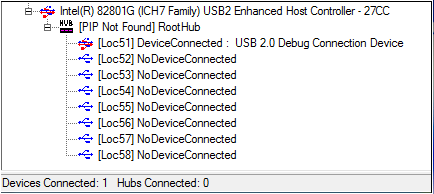
Fig.5 – Ajays Debug Device connected to USB Port 1
Step 7: Configure the WinDbg for USB Debug Mode
There are two ways to configure WinDbg for the USB debugging.
The first way: Create a shortcut with cmd parameters. To do this, perform the following steps:
- Create a shortcut for the WinDbg application.
- Right click on the shortcut and select Properties.
- Select the Shortcut tab and, in the Target field, enter:
“C:\windbg.exe” –b –k usb2:targetname=debugIn my opinion, the first method is much easier and does not require additional actions in future.
The second way: Configure on the Fly.
After the WinDbg start, do the following:
- In the main menu, select File -> Kernel Debug.
- Select the USB 2.0 tab and, in the Target name field, enter the name of the debug session. In our case, the Target name has the debug value.
Actions described above are displayed on Figure 6.
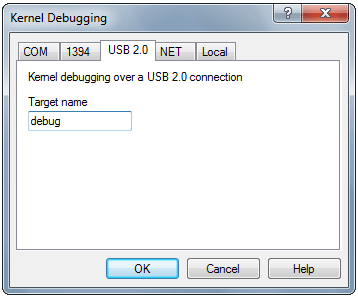
Fig.6 – WinDbg configuration on the Fly
Windows OS Debug Using the USB Bus
Everything is ready for debugging. The general view of the Host Machine + USB + Target Machine scheme is displayed on Figure 7. To make it clear, all other functional parts of the PC were disconnected.
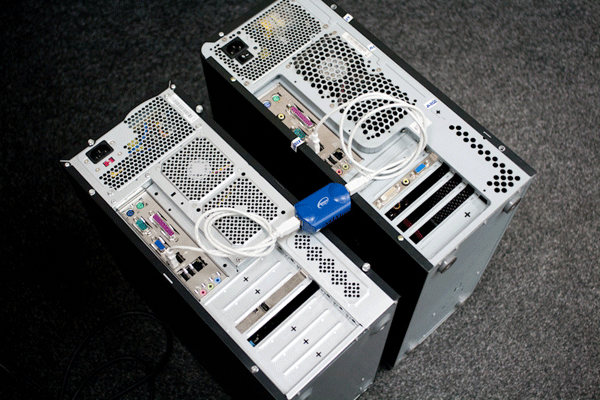
Fig.7 – Host Machine + USB + Target Machine
Start the USB-Debugging
On the host machine, after the debugger start, the following record will be displayed in the Command window:
Microsoft  (R) Windows Debugger Version 6.11.0001.404 AMD64
Copyright  (c) Microsoft Corporation. All rights reserved.

Using USB2  for debugging
Waiting to  reconnect...
After this, start the target machine, select the “Debug” boot record, and continue the work.
After some time, if all actions described above were performed correctly, the service information will be displayed in the debugger Command window as on Figure 8.
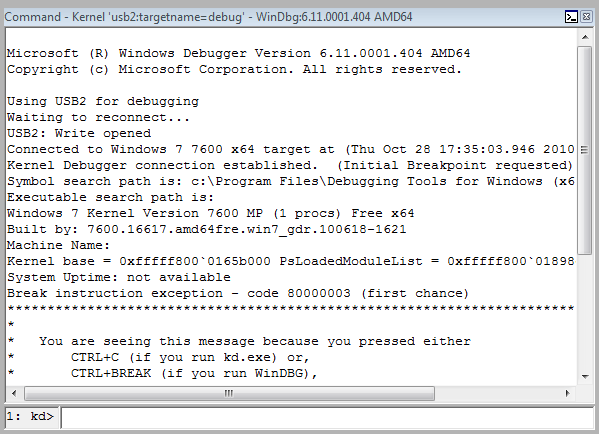
Fig.8 – Service information about Target Machine
Sometimes, there are cases when the debugger displays the service information but the initial breakpoint doesn’t work. To move to the full-fledged debug mode, you need to press Ctrl + Pause / Break by yourself.
And that is all! Now, you can perform the debugging of any device with installed OS not lower than Windows Vista, including Windows 7/8, and that has a USB bus with the USB port 1.
Links:
- Ajays NET20DC device manufacturer web site: http://ajaystech.com/net20dc.htm
- WinDbg debugger is available for downloading at http://www.microsoft.com/whdc/devtools/debugging/installx86.mspx or http://www.windbg.org/
- USBView program is available for downloading at http://www.ftdichip.com/Support/Utilities/usbview.zip


