 Skip to main content
Building efficient software with few to no bugs is a challenging but realistic goal. To achieve it, you should not only apply development best practices but also create and follow a robust continuous code quality assurance (QA) strategy.
Such a strategy will help you control code quality from early development stages, quickly detect and fix bugs, and improve overall software reliability. Continuous code quality assurance often includes static testing of source code right after it’s written. It’s also important to apply automated tools for static code analysis to accelerate the testing process and detect defects as soon as possible.
In this article, we explore the importance of continuous code quality assurance and discuss the benefits of using SonarQube for static code analysis. We also offer expert tips on how to:
- Configure SonarQube
- Integrate code analysis into an existing continuous integration and continuous delivery (CI/CD) pipeline
- Develop and implement a continuous code quality assurance strategy
This article will be useful for QA and DevOps specialists, developers, and managers who want to ensure top-notch product quality.
Contents
- Importance of continuous code quality assurance
- Using SonarQube for static code analysis: benefits and main components
- Configuring SonarQube for static code analysis
- Analyzing code with SonarQube
- Generating test coverage reports
- Integrating SonarQube into an existing CI/CD pipeline
- Developing and implementing a code quality assurance strategy
- Conclusion
Importance of continuous code quality assurance
To make sure software works efficiently and securely, it’s essential to thoroughly test it during all development stages and every time a new update is released.
That’s why Apriorit’s QA experts have established a quality assurance process based on fundamental principles of the International Software Testing Qualifications Board (ISTQB). Our process is aimed at detecting defects in software during development and continuously evaluating the product’s condition. Below, we share our way of ensuring continuous quality assurance when building software.
In a nutshell, an efficient software testing and QA routine includes the following principles:
- Early use of QA for thorough analysis of requirements and early detection of defects
- Thorough planning and management of every testing process
- Constant code quality checks based on code reviews, unit testing, and static code analysis
- Implementation of risk-based and other testing strategies
- Frequent and detailed test reporting
To detect issues early on with a product under development, it’s best to engage the QA team during requirements analysis and testing. In particular, QA specialists can help you develop and implement a code quality assurance strategy.
Continuous code quality assurance is one of the core principles behind the continuous integration (CI) software engineering practice, which includes automated testing and automated code inspection during the entire product lifecycle.
During the early development stages, QA specialists have to cover a sufficient amount of code with tests and continuously control test coverage along with overall code quality.
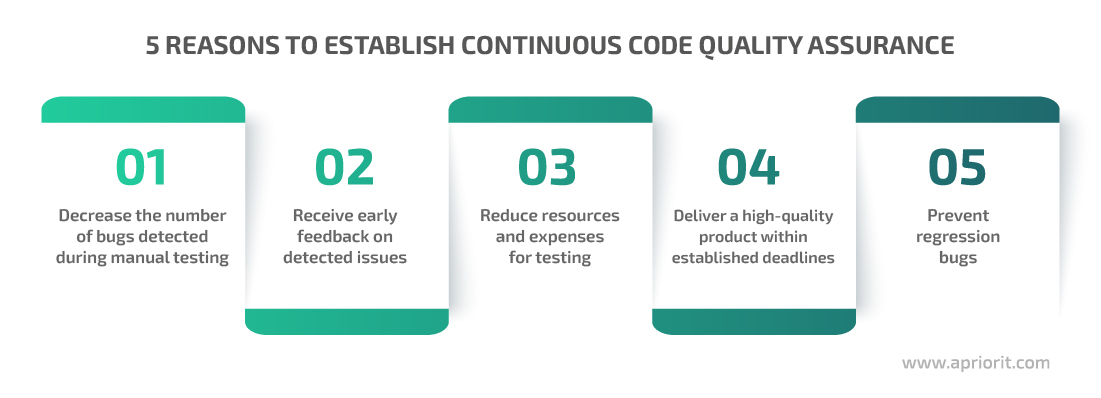
Here are five examples of how continuous improvement of code reliability and stability can help you enhance your software:
Product quality is the responsibility of the entire project team. At Apriorit, QA engineers and developers equally participate in creating and implementing a code quality assurance strategy. And one of the key techniques for ensuring proper code quality is static code analysis.
Static code analysis is a method of debugging a product by examining its source code before it’s run. This is done by analyzing a piece of code against a set of coding rules.
To perform automated static code analysis, QA specialists use a static code analyzing tool. At Apriorit, we use SonarQube.
Let’s see how to improve code quality with SonarQube by discussing the main benefits of this tool and exploring its components.
Using SonarQube for static code analysis: benefits and main components
There are many tools you can use for improving code quality with static code analysis: SonarQube, PVS-Studio, DeepSource, and Embold, to name a few. The choice of a particular tool depends solely on your project’s specifics. At Apriorit, we rely on SonarQube, and here’s why.
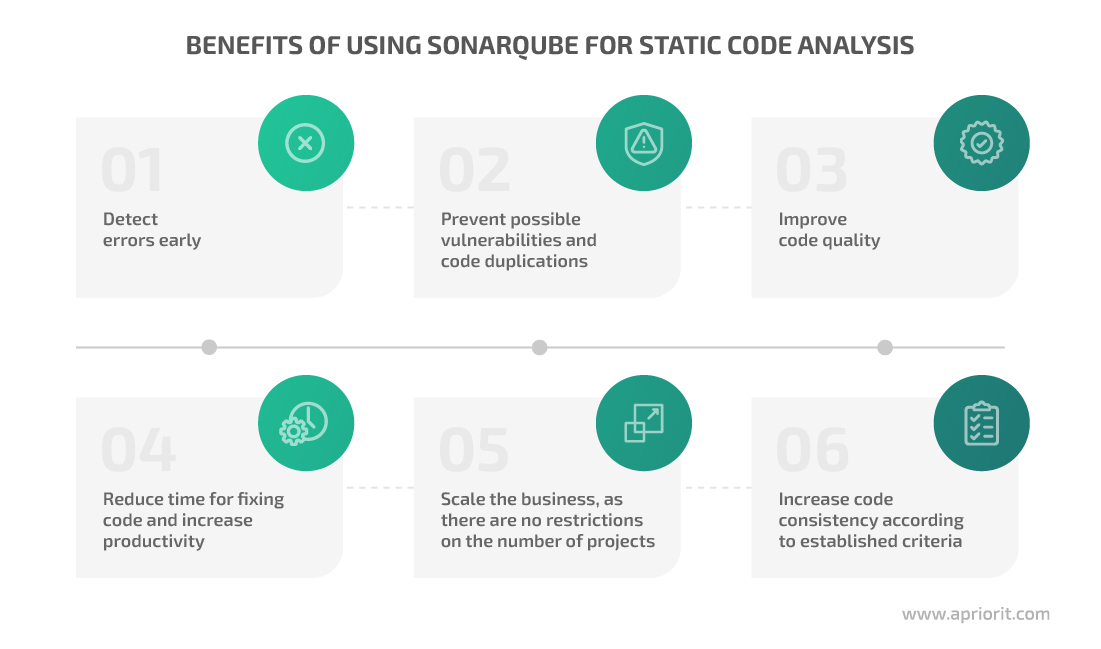
SonarQube is a tool for automatic code review and static code analysis that detects bugs, vulnerabilities, and code smells. SonarQube supports 29 programming languages, analyzes branches in repositories including GitHub and Bitbucket, and provides wide CI/CD integration capabilities with Jenkins, Azure DevOps server, and other tools.
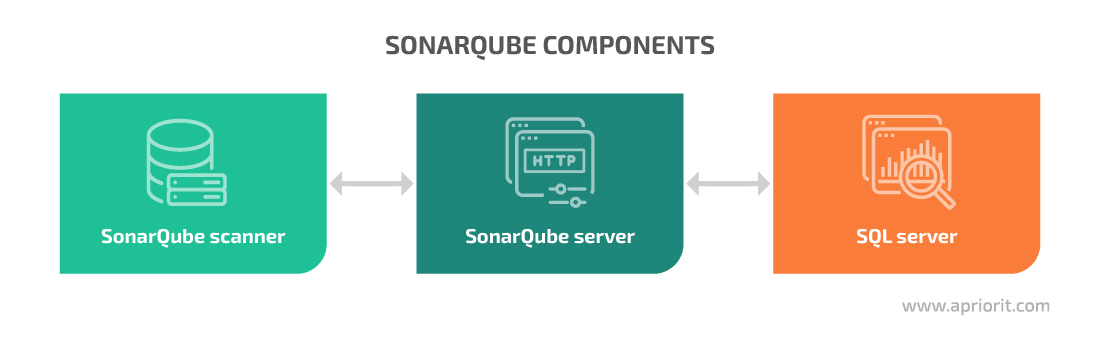
How does SonarQube work? Let’s start with its main components:
- SonarQube scanner performs code analysis based on a set of rules for the current programming language. This tool comes with a predefined set of rules, which can be modified and expanded according to the project needs.
- SonarQube server processes code analysis results and provides a web interface for reports and settings.
- SQL server is required for the SonarQube server to function. The SonarQube tool supports PostgreSQL, MS SQL, and Oracle.
Both SonarQube server and scanner can run on Windows, Linux, and macOS, and they require Java to be installed. SonarQube is available in Docker as well, but with some limitations.
Several commercial editions of SonarQube are available along with a free Community Edition. They differ in the number of programming languages supported out of the box and available features such as code branch analysis.
Examples provided in this article come from the SonarQube Developer Edition. In the following section, we share our experience setting up the SonarQube tool for static code analysis and offer you a brief summary of this process.
Configuring SonarQube for static code analysis
SonarQube has its own documentation that provides detailed information on how to configure and use its services. However, it may be a little challenging to find the best course of action if you haven’t worked with SonarQube before. That’s why we’ve prepared a short step-by-step guide for quick and easy configuration.
In this section, we offer seven steps to configure SonarQube Developer Edition and show code for our example project, called TestProject.
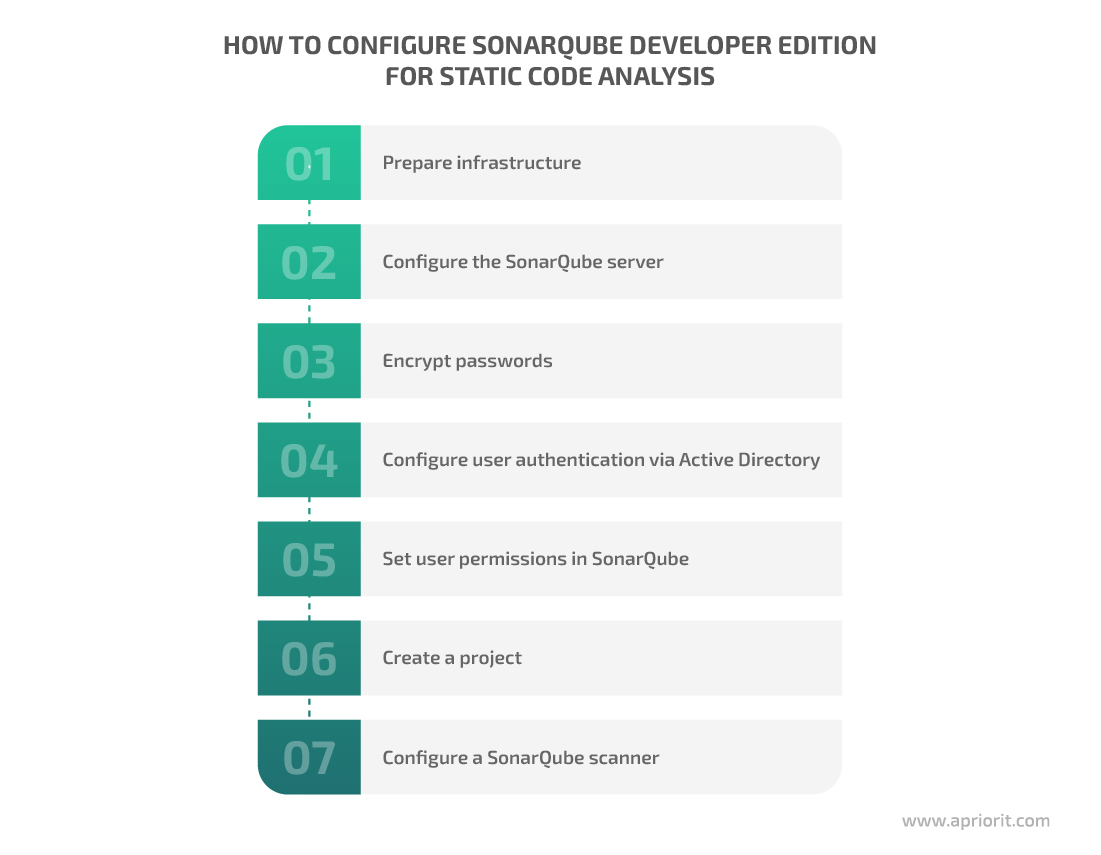
1. Prepare infrastructure
First, make sure that your server component is:
- Permanently available, as it will be used in the CI/CD pipeline around the clock. For our test project, we deployed the SonarQube server on a dedicated virtual machine in the cloud.
- Properly secured from both external and internal threats, as SonarQube can be used to gain access to your application’s source code. At Apriorit, we have our own internal security audit checklist and recommendations that we rely on, along with industry-specific requirements.
Then, check out technical requirements for your infrastructure. Below, we offer a brief summary of SonarQube’s hardware and software requirements for every component:
| SonarQube server | Hardware | CPU: For large projects or a group of projects, SonarQube documentation recommends using 8 or more CPU cores. RAM: For small projects, it’s best to use at least 3GB of RAM (1GB for the OS and 2GB for the SonarQube server). Large projects require at least 16GB. Disk storage: Choose separate disks (not system residence disks) with high write/read performance. It’s not recommended to use remote disks and network layers. The required disk space depends on the amount of code under analysis. For example, after three months of not too frequent analysis, 600,000 lines of code and the SonarQube server binary took up almost 2GB of space. |
| Software | OS: Windows, Linux, or macOS Oracle JRE 11 or OpenJDK 11 | |
| SonarQube scanner | Software | OS: Windows, Linux, or macOS Oracle JRE 11 or OpenJDK 11 |
| SQL server | Hardware | Depends on the requirements of the chosen SQL server. The database will not take much space because it only stores settings and reports. For example, after three months of not too frequent analysis, our project’s database was less than 1GB. |
| Software | MS SQL 12-15, PostgreSQL 9.6-13, Oracle 12C/18C/19C/XE Editions |
2. Configure the SonarQube server
To install the SonarQube server, you only need to perform three simple steps. Here’s how to do it on Windows:
- Download the SonarQube server from the official website.
- Unpack the archive and place it on the chosen disk in your chosen directory.
- Go to the conf folder and open the sonar.properties file for editing. Configure settings for the database connection. Type in the login and password of a SQL server user and the path to the database. In the example below, the database name is sonarqube:
# Example for PostgreSQL
sonar.jdbc.username=sonarqube
sonar.jdbc.password=mypassword
sonar.jdbc.url=jdbc:postgresql://localhost/sonarqube
To launch the SonarQube server, you can use the StartSonar.bat script from the bin folder. However, it’s more convenient to create your own service and use it to manage the SonarQube server. To do that, launch a command-line interface from the admin account and execute the following command:
> sc create SonarQube binPath= "\"%SONAR_DIR%\bin\windows-x86-64\wrapper.exe\" -s \"%SONAR_DIR%\conf\wrapper.conf\""Use the StartNTService.bat and StopNTService.bat scripts from the bin folder to manage your service. Note: %SONAR_DIR% is the directory where the SonarQube server is installed.
> "%SONAR_DIR%\bin\windows-x86-64\StartNTService.bat"
> "%SONAR_DIR%\bin\windows-x86-64\StopNTService.bat"
Now let’s proceed to configuring the web server. By default, the SonarQube web server is available via HTTP on port 9000, at the “/” path. For example, it can be http://yourSonarQubeServerURL:9000/.
You can change web server settings using the sonar.properties file in the conf folder:
sonar.web.host=192.168.0.1
sonar.web.port=80
sonar.web.context=/sonarqube
We also recommend configuring access to the web interface of the SonarQube server via HTTPS. The SonarQube documentation shows examples of doing this with Apache Proxy, Nginx, and IIS. The last option is the most convenient for Windows.
If your SonarQube server connects to external services via HTTPS (for example, if it integrates with application lifecycle management (ALM) systems), make sure to add a certificate used by those services to the storage of trusted Java certificates on the SonarQube server.
Note: Adding a route certificate from a certificate authority will ensure communication using all certificates issued by this certificate authority without needing to add each certificate separately. For example, here’s how you can do it for your internal corporate network:
1. If a certificate is saved in binary format, convert it to plain text. To do that, you can use the openssl utility:
> openssl x509 -inform DER -in certificate.cer -out certificate.crt2. Add the received certificate to the machine with SonarQube server installed.
3. Go to the Java directory, open the bin folder, and add the certificate to trusted certificates using keytool:
> keytool -import -trustcacerts -alias ca-cert -file /path/to/certificate.crt -keystore ..\lib\security\cacertsThe default password for the certificate storage is changeit. Once you’ve configured all settings, make sure to restart both Java and the machine.
If you need to update the server, here’s how to do it:
- Download a packet with the update to the SonarQube server and unpack it to a new directory.
- Transfer settings from the conf/sonar.properties file on the current SonarQube server to the same file on the new server.
- Stop the current SonarQube server service and launch the updated version.
- Open http://yourSonarQubeServerURL/setup and follow the instructions.
3. Encrypt passwords
Storing passwords in plain text isn’t secure, so consider encrypting passwords using SonarQube:
- Go to the web interface of the SonarQube server (Administration -> Configuration -> Encryption) and click Generate Secret Key.
- Save the generated key to the .sonar/sonar-secret.txt file in the SonarQube server directory. The .sonar directory is hidden. You can store a file with secrets in another place. Just specify the path to the chosen file in the conf/sonar.properties file using the sonar.secretKeyPath= parameter. Make sure to deny access to Properties in the Security tab, allowing access only to the user who launched the SonarQube server. Once you’ve adjusted these settings, restart the SonarQube server.
- Open the web interface again and go to Administration -> Configuration -> Encryption. Then type in a password and click Encrypt. Copy the received value.
- Add the encrypted password to the settings of the SonarQube server in conf/sonar.properties.
4. Configure user authentication through Active Directory
To configure user authentication through Active Directory (AD), go to the SonarQube server’s directory and open the conf/sonar.properties file. Let’s see how it’s done in our TestProject example:
# General Configuration
sonar.security.realm=LDAP
ldap.url=ldap://dc.corp.local:389
ldap.bindDn=cn=sonar-user,cn=Users,dc=corp,dc=local
ldap.bindPassword={aes}xxxxxxxxxxxxxxxxxxxxxxxxxxxxxxxxxxxx=
ldap.authentication=simple
ldap.realm=corp.local

# User Configuration
ldap.user.baseDn=cn=Users,dc=corp,dc=local
ldap.user.request=(&(objectClass=user)(sAMAccountName={login})(memberOf=cn=TestProject,ou=projects,ou=Groups,ou=Company,dc=corp,dc=local))
ldap.user.realNameAttribute=cn
ldap.user.emailAttribute=mail

# Group Configuration
ldap.group.baseDn=ou=Groups,ou=Company,dc=corp,dc=local
ldap.group.request=(&(objectClass=group)(member={dn}))
Where:
- ldap.url points to a domain controller
- ldap.bindDn and ldap.bindPassword stand for a domain user for binding with AD
- ldap.user.baseDn is the place in the AD tree where the search for a user starts
- ldap.user.request is a request for authenticating a user in AD when a user logs in to a SonarQube server’s web interface
Here are a few more important nuances of using AD groups in SonarQube:
- The SonarQube server doesn’t retrieve groups to which a user belongs. You need to create a user group on the local SonarQube server with the name of an existing AD group. Then, when a user logs in, SonarQube maps local groups in AD to determine whether the user belongs to a certain group.
- An AD user can’t be a member of local groups on the SonarQube server if such groups don’t exist in AD. The only exception is the local sonar-users group.
5. Set user permissions in SonarQube
All users are added to the local sonar-users group on the SonarQube server by default. These users initially don’t have any permissions, so you need to assign permissions to specific users or groups of users.
To assign general permissions, go to Administration -> Security -> Global Permissions and choose permissions from the list:
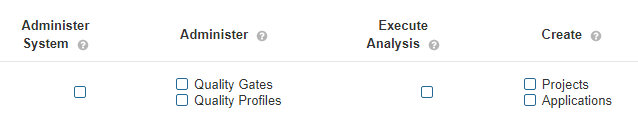
Screenshot 1. Global permissions
To assign permissions for specific projects, go to Project Settings -> Permissions and choose from the list. On this page, you can also change publicity settings for your project. For example, you can hide the project from users.
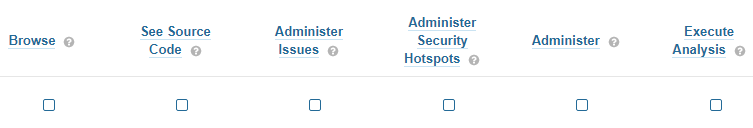
Screenshot 2. Project permissions
6. Create a project
To create a new project, click Add project on the Projects page. The Manually option allows you to create a project manually by specifying:
- The Project key parameter that will be passed to the SonarQube scanner
- The Display name parameter that will be displayed in the web interface
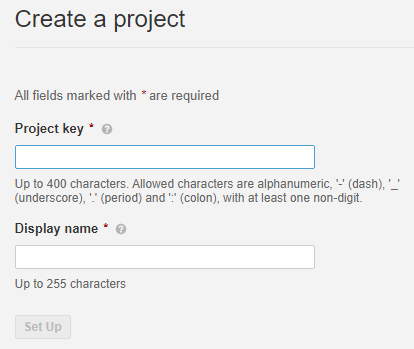
Screenshot 3. Create a project manually
If you have an integration with an ALM system, you can create a project automatically based on your current repositories.
Once a project is created, SonarQube will offer to manually generate a token for project analysis. Each token will be attached to a certain user account, so make sure users are granted permission to launch project analysis using the Execute Analysis option.
If you use the SonarQube instance for only one project, consider creating a technical user account and granting analysis permissions exclusively to it. This way, you’ll need to generate a token for only one user. To do so, go to Administration -> Security -> Users -> Update Tokens. Here you can also withdraw tokens that were issued earlier.
7. Configure a SonarQube scanner
SonarQube scanner offers different types of scanners and plugins, including ones that can work with tools like Gradle, .NET, Maven, Azure DevOps, Jenkins, and Ant. You can choose the most suitable one depending on your project specifics.
If none of the suggested SonarQube scanners fits your projects, use SonarScanner (CLI).
Here’s how you can install SonarScanner (CLI):
- Download the scanner from the official website.
- Unpack the archive.
- Add a path to the scanner to the
PATHvariable in the bin directory. - Specify the path to the SonarQube server in the conf/sonar-scanner.properties file.
Now let’s move to setting up HTTPS for the SonarQube scanner. If you configured a connection to the SonarQube server through HTTPS, you need to add your certificate to trusted Java certificates (the process is similar to what we explained in the Configure the SonarQube server section.
After that, you can successfully connect to the scanner. Once you finish configuring the scanner, restart both Java and the machine.
Once you’re done installing and configuring SonarQube server and scanner, it’s time to move to code analysis.
Analyzing code with SonarQube
SonarQube performs static analysis of source code and files with compiled code for some files like .class files in Java and .dll files in C#. Therefore, in some cases, you should build your program before starting code analysis.
Make sure to pass your project key using the sonar.projectKey parameter and your authentication token using the sonar.login parameter to the SonarQube scanner via the SonarQube server. It’s impossible to start code analysis without those parameters. Depending on your project’s goal and specifics, you might also need to specify additional parameters such as project version number, branch name, and exceptions.
You can use your existing project’s settings, program build templates, and scripts as the basis for code analysis configurations. Say there’s a project component that can be built by launching the ./build.sh script:
cmake --build {parameters} ../src/To analyze this component, copy the script and add code for launching the SonarQube scanner from the directory with the source code to that script:
cmake --build {parameters} ../src/
cd ../src/
sonar-scanner -Dsonar.projectKey=TestProject -Dsonar.login=XXXXXXXXXXXXXXXXXXXXXXXXXXXXXXXXX
If you plan to regularly analyze this component, it’s best to specify its version every time you run code analysis:
cmake --build {parameters} ../src/
cd ../src/
sonar-scanner -Dsonar.projectKey=TestProject -Dsonar.login=XXXXXXXXXXXXXXXXXXXXXXXXXXXXXXXXX -Dsonar.projectVersion=1.0.0
The Developer Edition of SonarQube allows you to analyze different branches within an individual project. To do that, you’ll need an additional parameter:
cmake --build {parameters} ../src/
cd ../src/
sonar-scanner -Dsonar.projectKey=TestProject -Dsonar.login=XXXXXXXXXXXXXXXXXXXXXXXXXXXXXXXXX -Dsonar.projectVersion=1.0.0 -Dsonar.branch.name=TestBranch
If the analysis fails to launch and the error description isn’t informative enough, you can extend SonarScanner logs using the following parameter:
cmake --build {parameters} ../src/
cd ../src/
sonar-scanner -Dsonar.projectKey=TestProject -Dsonar.login=XXXXXXXXXXXXXXXXXXXXXXXXXXXXXXXXX -Dsonar.projectVersion=1.0.0 -Dsonar.branch.name=TestBranch -Dsonar.verbose=true
You can change parameters for each new analysis, so it’s best to specify them as arguments. Here’s an example of launching the sonar-analyze.sh script with parameters for code analysis in the shell environment:
./sonar-analyze.sh TestProject XXXXXXXXXXXXXXXXXXXXXXXXXXXXXXXXX 1.0.0 TestBranch trueAnd here’s the body of the launched script:
cmake --build {parameters} ../src/
cd ../src/
sonar-scanner -Dsonar.projectKey=$1 -Dsonar.login=$2 -Dsonar.projectVersion=$3 -Dsonar.branch.name=$4 -Dsonar.verbose=$5
Your project can use parameters that rarely change or don’t change at all. In order to avoid cluttering your script with a long list of such parameters, you can list them all in a sonar–project.properties file and place this file in the directory with the source code:
sonar.projectKey=TestProject
sonar.coverageReportPaths=coverage/coverage.xml
sonar.cfamily.cache.enabled=false
sonar.exclusions=*Test/**/*,IntegrationTests/**/*
In the example above, we:
- Transferred the project key and the path to the test coverage report to the sonar–project.properties file
- Turned off caching of C/C++/Objective-C code analysis
- Excluded files and directories with tests from the analysis
Generating test coverage reports
SonarQube doesn’t generate code test coverage reports, so you need to use a third-party solution to analyze test coverage. You can add a test coverage report to the SonarScanner so it’s displayed in the analysis results.
You can generate test coverage reports with tools you use to run tests or calculate test coverage. Let’s explore a few examples:
VSTest (Windows)
Say you’re running tests using the vstest.console.exe command-line tool:
> vstest.console.exe TestTest.exe /inisolation /logger:trx /platform:x64 /TestAdapterpath:$(SolutionDir)packages\googletestadapter.0.12.2\build\_common"To generate a test coverage report, you only need to add the following parameter:
> vstest.console.exe TestTest.exe /inisolation /logger:trx /platform:x64 /TestAdapterpath:$(SolutionDir)packages\googletestadapter.0.12.2\build\_common" /EnableCodeCoverageAfter that, the report will be saved in the previously chosen directory in the .coverage format. To enable the SonarScanner to parse that information, you need to convert the report into a format that the SonarQube scanner can read. To do this, you can use the CodeCoverage utility that’s available in Visual Studio:
> "%VSDIR%Team Tools\Dynamic Code Coverage Tools\CodeCoverage.exe" analyze /output:coverage.xml TestTest.coverageOnce the CodeCoverage utility converts the report into .xml format, you can pass it to the SonarQube scanner.
> SonarScanner.MSBuild.exe begin /k:"TestProject" /d:sonar.login=XXXXXXXXXXXXXXXXXXXXXXXXXXXXXXXXX /d:sonar.branch.name=TestBranch /d:sonar.cfamily.vscoveragexml.reportsPath=path\to\coverage.xml
> msbuild build.proj /t:Build
> SonarScanner.MSBuild.exe end /d:sonar.login=XXXXXXXXXXXXXXXXXXXXXXXXXXXXXXXXX
gcovr (Linux)
If you run tests using the ctest executable and gather test coverage results with the gcovr utility, you can also use the latter to generate a report for the SonarScanner:
gcovr --sonarqube coverage/coverage.xmlThe utility will generate a coverage.xml report that you can pass to the SonarScanner:
sonar-scanner -Dsonar.projectKey=TestProject -Dsonar.login=XXXXXXXXXXXXXXXXXXXXXXXXXXXXXXXXX -Dsonar.projectVersion=1.0.0 -Dsonar.branch.name=TestBranch -Dsonar.coverageReportPaths=coverage/coverage.xmlllvm-cov (macOS)
If you’re running tests using the xcodebuild command-line tool and gathering test coverage results using the llvm-cov utility, you can generate a report using the show command:
( xcrun llvm-cov show --instr-profile ${PROFILE} --format=text ${BIN} ) > ./coverage.jsonThen, specify a path to the generated report:
sonar-scanner -Dsonar.projectKey=TestProject -Dsonar.login=XXXXXXXXXXXXXXXXXXXXXXXXXXXXXXXXX -Dsonar.projectVersion=1.0.0 -Dsonar.branch.name=TestBranch -Dsonar.cfamily.llvm-cov.reportPath=path/to/coverage.jsonNote that reports generated with llvm-cov can only be added to the Developer Edition of SonarQube server.
Integrating SonarQube into an existing CI/CD pipeline
At Apriorit, we use Bamboo to build the CI/CD pipeline and have several individual jobs responsible for building certain components or configuring an environment. We also use build agents — machines within the corporate or project infrastructure that also have a Bamboo agent installed.
If you also build a project on Bamboo, it makes sense to configure code analysis there as well. Here’s how you can integrate SonarQube into your existing CI/CD pipeline in six steps:
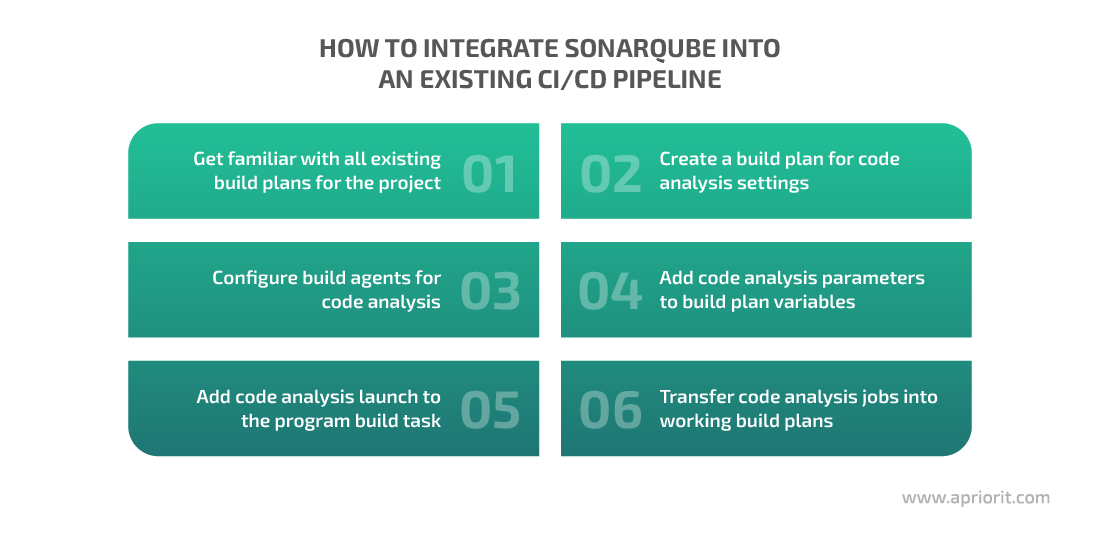
1. Get familiar with all existing build plans for the project
Usually projects have several build plans for testing, release, individual components, and so on. Make sure to get familiar with every build plan and its goals before choosing those that will be the most suitable for analyzing code with SonarQube. For instance, you might want to choose the build plan used for release, as it covers all project components and configurations used for testing and delivering your software.
2. Create a build plan for code analysis settings
If there’s already a build plan that contains all components for analysis, you can clone it to Bamboo.
Otherwise, you can create a new plan from scratch and fill it with build jobs (copied from existing plans) for all project components you’re going to analyze. Make sure to transfer settings like repositories, variables, and build agents from original plans to the new build plan.
There are two reasons to configure analysis settings in a separate build plan (also called a test build plan):
- Configuring analysis settings in an existing build plan may temporarily disable this build plan and disturb the ongoing development process.
- You will be able to use this separate build plan in the future if you need to analyze code without issuing a new program version.
3. Configure build agents for code analysis
Make sure to install the SonarQube scanner on all build agents involved in building your project. See concise instructions on how to do it in the previous section.
4. Add code analysis parameters to build plan variables
The most essential parameters to add as variables into a build plan are the URL address of the SonarQube server and the token. Otherwise, if these parameters change with time, you’ll have to change them accordingly in every analysis task, which is time-consuming.
Another advantage of using variables in the build plan is the opportunity to hide their values by adding the secret parameter to variable names.
Later, when working on program building and analysis, you can refer to these variables in the following format: ${bamboo.<name_of_a_variable>}, e.g. ${bamboo.SonarUrl} and ${bamboo.SonarTokenSecret}.
5. Add code analysis launch to the program build task
Say you need to build a component on Bamboo and launch the following command:
./build.sh ${parameters}Let’s add a script for launching code analysis:
./build.sh ${parameters}
./sonaranalyze.sh ${bamboo.SonarUrl} ${bamboo.SonarTokenSecret}
If your analysis script receives many arguments and their values are obscure (for example, the scanner opens extended logs if you use the –Dsonar.verbose=true parameter), you can pass these values as variables:
SONAR_THREADS=2
SONAR_VERBOSE=false
BRANCH=${bamboo.planRepository.branchName}

 ./build.sh ${parameters}
./sonaranalyze.sh ${bamboo.SonarUrl} ${bamboo.SonarTokenSecret} ${BRANCH} ${SONAR_THREADS} ${SONAR_VERBOSE}
The ${bamboo.planRepository.branchName} variable in the example above retrieves the name of the current branch.
6. Transfer code analysis jobs into working build plans
Once you configure and check a test build plan for code analysis, move code analysis jobs to production build plans that are regularly used for release or other development tasks. Now you can control the quality of the product version before testing it. We also recommend delegating configuring of working build plans to a development manager or a responsible developer.
Configuring Quality Profiles and Quality Gates
SonarQube has Quality Profiles — default sets of code analysis rules for all supported languages. You can modify the rules in these Quality Profiles depending on your project’s goals and specifics.
To configure Quality Profiles, just click Quality Profiles in the menu on the SonarQube server web interface. Here you can find options for copying and extending your current profile or creating a new one. To keep track of changes in the profile, use the Changelog option.
Quality Gate helps you identify whether a current product version meets the project requirements. You might want to apply different Quality Gates for different components.
For instance, if one component has several thousand lines of code and zero bugs, adding even one bug is undesirable. Meanwhile, if a component contains 100,000 to 200,000 lines of code and 1,000 bugs, one new bug can be acceptable.
You should also modify Quality Gates as your product evolves.
The SonarQube team recommends using the default Quality Gate called Sonar way.
To create and configure a new Quality Gate, click on it in the web interface of the SonarQube server and choose Create. You can also use the Copy option to make a copy of an already configured Quality Gate (with a new name) and then modify it.
Use the Add Condition option to add new parameters that will be used to validate a new build. You can validate all code or only newly added code. Quality Gates will be marked as not passed if at least one condition for a specified parameter isn’t met.
We perform code analysis and check against Quality Gates for every build. In case a build doesn’t pass analysis, it’s considered failed. In that case, we issue a bug with the Blocker priority and ask a developer to fix code degradation (also called code rot or software rot) as soon as possible.
By following our recommendations, you can continuously control source code quality using SonarQube in order to detect and prevent code rot. As a result, you can improve your code quality, which in turn improves your product stability.
Developing and implementing a code quality assurance strategy
Once you’ve dealt with configuring the SonarQube server and analyzing project components, it’s time to develop and implement your code quality assurance strategy.
At Apriorit, we recommend basing your code quality strategy on preventing code rot. When starting a project, choose the most important metrics to keep an eye on and implement mandatory static code analysis right away. When configuring Quality Gates, make sure to set all metrics to zero. Thus, you can make sure code quality won’t decrease with time.
Sometimes you might work with projects that already have legacy code and you might perform static code analysis with SonarQube in the middle of the project. In this case, we recommend following the non-degradation strategy by making all metric values equal to their current values according to the first code analysis and making sure these metrics don’t deteriorate.
It’s also a good practice to review metrics in Quality Gates settings: for example, once a week. Due to continuous code changes and improvements, metric values also improve over time.
It’s also vital to add the test coverage control metric to your project’s Quality Gates and check it following the same non-degradation strategy.
The main metrics we recommend adding to Quality Gates are:
- Bugs with Blocker, Critical, and Major priorities
- Vulnerabilities with Blocker, Critical, and Major priorities
- Security hotspots with High and Medium priorities
- Code test coverage
When configuring Quality Gates, specify two types of conditions for these metrics:
- Conditions in New Code
- Conditions in Overall Code
At Apriorit, we set values for all metrics to greater than 0 for Conditions in New Code, and to less than 100% for Security Hotspots.
In the Conditions in Overall Code, we set metrics to be greater than the current values (according to the metrics we got during the first analysis), since we don’t want the current metrics to deteriorate.
Conclusion
Knowing how to configure and use SonarQube will help you unleash the full potential of this powerful static code analysis tool. Applying SonarQube regularly, integrating it into your project’s CI/CD pipeline, and developing a test strategy based on analysis results will allow you to significantly enhance both the development process and overall product quality.
At Apriorit, we always add static source code analysis as an additional step in our CI/CD pipeline for all projects we’re working with. Thus, we manage to decrease the number of issues in our IT products.
Our professional QA and testing teams are ready to help you efficiently improve your code quality with SonarQube, ensure your product’s reliability, consult on QA strategies and activities, and perform an unbiased software quality review.
Apriorit helps businesses improve product efficiency, performance, and security. Contact us to get expert assistance in ensuring the quality of your software right now!


