 Skip to main content
An increasing number of internet attacks is forcing enterprises to take control of their network activities as part of their security policies.
A wide range of intrusion detection systems (IDSs) have been designed to help enterprises protect their network infrastructures. But as a commercial IDS usually costs thousands of dollars, this software may be financially burdensome for small businesses. Fortunately, open source IDSs can also be efficiently used for these purposes. They offer modifiable plugins that can dynamically scan your network and ensure detection of intrusions from the internet.
In this article, we provide a detailed report of our study on analyzing network activities with the free Bro IDS and Intel Critical Stack. Our study proved the effectiveness of these systems for detecting network intruders in real-time. We also used the ELK Stack to visualize only collected data that’s useful for network intrusion analysis.
This article may be useful for security administrators and DevSecOps engineers who are looking for alternative ways of detecting suspicious network activities, as well as for developers researching new techniques for custom network software development.
Written by:
Andrey Lomakin,
Test Engineer on the Network Testing Team
and Liliia Bidniak,
QA Lead on the Network Testing Team
Contents:
Study Goals
The goal of this study was to set up an effective network intrusion analysis environment using a combination of open source tools.
As the main monitoring tool, we chose Bro IDS, an effective open source solution that collects information about all network activities within an enterprise. At the same time, it generates an enormous number of logs that are difficult for system administrators to analyze without any separation or visualization. Thus, we needed to define what logs of network activities could potentially indicate suspicious activity and how to visualize this data in a form convenient for further network intrusion analysis.
Our Approach
For our study, we wanted to build a monitoring system with a minimal number of components.
After we ran the system in a testing environment and got results, we would investigate those results and provide recommendations for the system’s deployment in a real network environment.
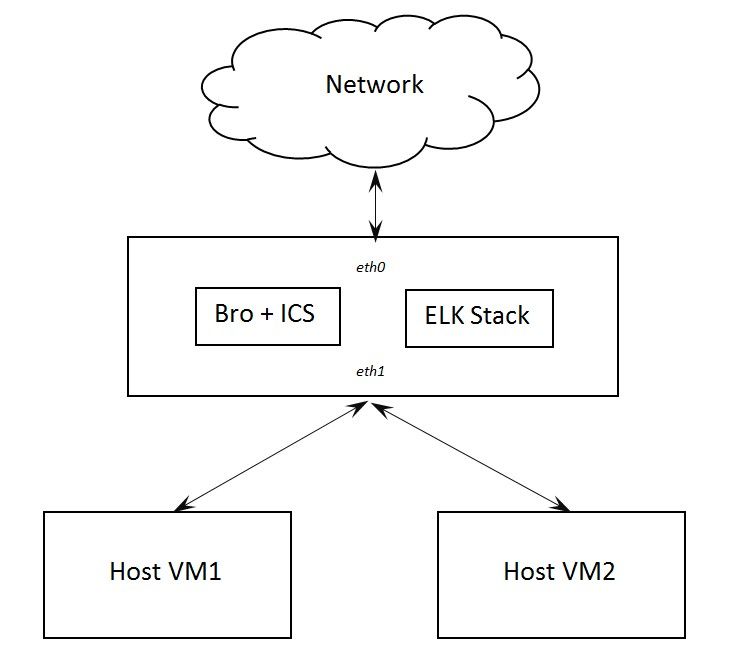
The monitoring system we tested consists of the following components:
- Host – a monitoring object that generates network activities
- Network intrusion detection system (IDS) – software for distributed analysis of the host’s traffic
- System for analyzing and visualizing data
- An operating system (OS) that runs on physical hardware, an operating system used for running the IDS, and R data analysis and visualization tools
We conducted all experiments in a testing laboratory that included several virtual machines replicating a corporate environment:
Software Overview
To implement our monitoring system, we chose the following software:
- IDS: Bro Network Security Monitor with Intel Critical Stack
- Data visualization: ELK Stack, which consists of Elasticsearch, Logstash, and Kibana
- OS: Ubuntu 16.04 virtual machine configured as an internet gateway
What is Bro IDS?
Bro Network Security Monitor is a Unix-style intrusion detection system that monitors network traffic and detects intrusions and abnormal activities.
Bro parses network traffic by extracting its application-layer semantics. After that, it detects intrusions by executing event-oriented Bro IDS protocol analyzers that compare the current traffic to potentially harmful patterns. As a result of this analysis, Bro can detect network attacks either by finding particular signatures or defining attacks in terms of events and specific conditions.
The system is also useful for detecting unusual activities like numerous host connections to certain services or patterns of failed connection attempts.
Keep in mind that Bro is not an in-line IDS that intervenes in network activities, though. Bro conducts analysis in parallel with network activities and sends alerts in case of attacks or unauthorized access if properly configured.
Why did we use additional software?
Intel Critical Stack is an addition to Bro IDS that has signatures for detecting malware websites. We installed Intel Critical Stack along with Bro IDS and then collected data on internet use and sent that data to the Intel Critical Stack database. Thus, we configured Bro and Critical Stack Agent in order to understand what malicious websites were visited.
The ELK Stack consists of three products – Elasticsearch, Logstash, and Kibana – that are necessary to collect, normalize, store, visualize, and analyze log data generated by Bro IDS. The results of network monitoring are written in different logs which aren’t always understandable by administrators. Thus, we used the ELK Stack to visualize data in charts that are convenient for conducting analysis and making decisions.
All the software we used is publicly available.
Testing the Workflow
We conducted our testing of the monitoring system in the following way:
- A client sends a request to the internet. Thus, the host generates network activities.
- Bro uses tcpdump to analyze traffic from the enp0s8 (eth1) interface and distributes records in logs using its plugins (including Intel Critical Stack).
- Elasticsearch uses Logstash to analyze Bro logs and collect them into a local database.
- Kibana extracts data from the database and builds patterns.
Data Visualization for Analysis
In order to visualize our network data in the most convenient way for analysis, we chose Kibana, which can clearly reveal suspicious activity in the network.
We chose the following charts for visualizing our data:
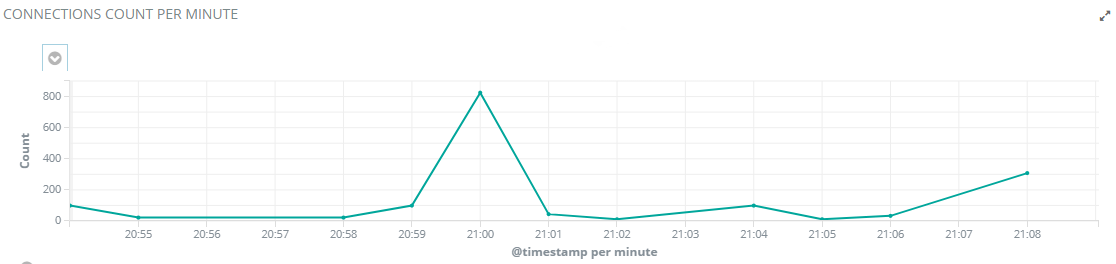
Connections Count per Minute Chart
The connections count per minute chart shows the total number of connections per minute. An increasing number of connections during non-working hours can be a sign of abnormal activity.
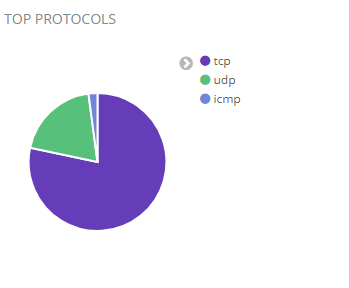
Top Protocols Chart
The top protocols chart shows how much and what type of traffic is going over the network.
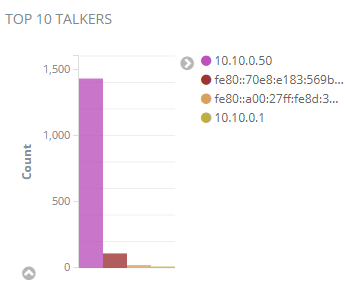
Top 10 Talkers Chart
The top 10 talkers chart indicates the most “talkative” computers, which can be potentially infected.
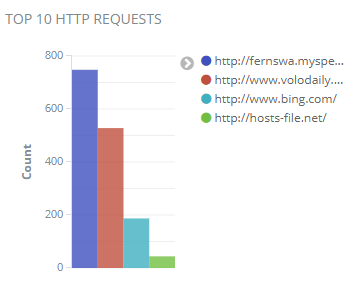
Top 10 HTTP Requests Chart
The top 10 HTTP requests chart shows requests that don’t have encryption, so these websites may be infected with malware.
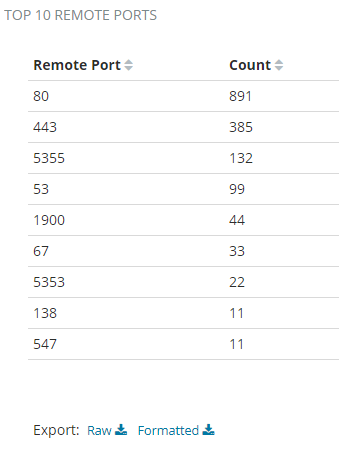
Top 10 Remote Ports Chart
The top 10 remote ports chart shows ports with the largest number of requests. An increasing number of connections and requests per minute to some ports may indicate suspicious activity.
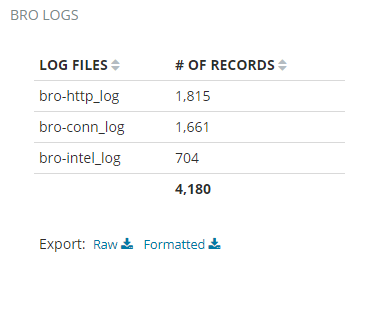
Bro Log Files
Bro log files shows the number of records in Bro files and the overall state of the Bro IDS.
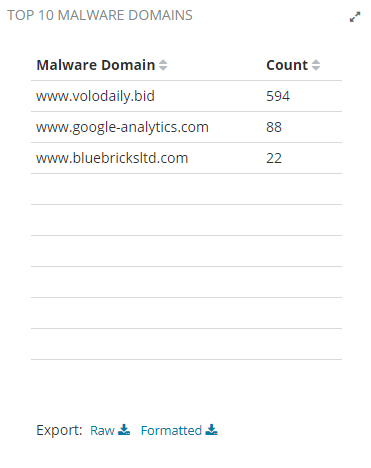
Top 10 Malware Domains Chart
The top 10 malware domains chart contains feed data from the malware database provided by Intel Critical Stack.
Database Cleanup
As mentioned above, during the course of normal operation Bro produces a large volume of log files.
However, if your database storage is limited, you can clean them up over a specified period of time. In order to delete unnecessary data, we used Curator for Logstash and added a daily task to Crontab to delete old ELK data.
Here’s the contents of actionfile.yml, according to which Curator chooses data for cleanup.
0 1 * * * curator /root/actionfile.yml
actionfile.yml:
actions:
 1:
  action: delete_indices
  description: >-
  options:
   ignore_empty_list: True
   timeout_override:
   continue_if_exception: False
   disable_action: False
  filters:
  - filtertype: pattern
    kind: prefix
    value: logstash-
    exclude:
  - filtertype: age
    source: name
    direction: older
    timestring: '%Y.%m.%d'
    unit: days
    unit_count: 30
exclude:Deploying the System on a Real Network
After analyzing the results of testing in the laboratory environment, we concluded that deploying the system on a real network would require the following:
- A switch with port mirroring
- A server with 32+ GB RAM and 6–10 TB HDD
Note that the system configuration you’ll need depends on the bandwidth of your network service provider. If you have several channels at 1 Gbps, you’ll need to install high-performance network equipment from Arista, Cisco, Myricom, or similar.
Guide for Installing and Configuring Components
1. Installing Bro IDS
Here’s a step-by-step guide to how we installed the components of our monitoring system and configured them for testing.
Configuring the virtual machine
For our study, we used a virtual machine with two network adapters: the first is for the internet connection while the second is for the intranet connection.
For performing all the following commands, you need root (superuser) privileges. Begin with installing the DHCP server:
apt-get install isc-dhcp-serverDo the following to configure it:
Add
INTERFACES="enp0s8"to the file /etc/default/isc-dhcp-server
Open the file /etc/sysctl.conf and uncomment
#net.ipv4.ip_forward=1Execute following command
sysctl -p /etc/sysctl.confIn the file /etc/network/interfaces you need to specify the following:
auto lo
iface lo inet loopback

auto enp0s8
iface enp0s8 inet static
address 10.10.0.1
netmask 255.255.255.0Configuring routing
You need to configure routing so that computers connected to the intranet get access to the internet. Begin with turning on the firewall:
ufw enableThen run rc-local. This is necessary for restoring iptables rules after the machine reboots.
systemctl enable rc-local.serviceOpen the file /etc/rc.local and add
/sbin/iptables-restore < /etc/iptables/rules.v4Then run the following:
iptables -t nat -A POSTROUTING -o enp0s3 -j MASQUERADE
iptables -A FORWARD -i enp0s8 -o enp0s3 -m state --state RELATED,ESTABLISHED -j ACCEPT
iptables -A FORWARD -i enp0s8 -o enp0s3 -j ACCEPT
iptables -A INPUT -p tcp --dport 5601 -j ACCEPT
iptables -A INPUT -p udp --dport 5601 -j ACCEPT
iptables-save > /etc/iptables/rules.v4Next, configure the DHCP server to automatically receive IP addresses. Open the file /etc/dhcp/dhcpd.conf and add the following:
subnet 10.10.0.0 netmask 255.255.255.0 {
  range 10.10.0.50 10.10.0.150;
  option broadcast-address 10.10.0.255;
  option routers 10.10.0.1;
  option domain-name-servers 10.10.0.1, 8.8.8.8;
}Installing dependencies for Bro
For Bro to operate properly, it needs certain applications to be installed. So run the following commands:
apt-get install cmake make gcc g++ flex bison libpcap-dev libgeoip-dev libssl-dev python-dev zlib1g-dev libmagic-dev swig libgoogle-perftools-dev
mkdir -p /nsm/broInstalling Bro IDS
To install Bro IDS, run the following commands:
cd ~Download Bro IDS:
wget https://www.bro.org/downloads/release/bro-2.4.1.tar.gzExtract the archive:
tar -xvzf bro-2.4.1.tar.gz
cd bro-2.4.1Configure installation and install Bro IDS:
./configure --prefix=/nsm/bro
make
make install
export PATH=/nsm/bro/bin:$PATHConfiguring Bro IDS
To configure Bro IDS, specify what interface will monitor network traffic in the node.cfg file:
nano /nsm/bro/etc/node.cfgSpecify which subnetwork should be monitored in networks.cfg:
nano /nsm/bro/etc/networks.cfgStarting Bro IDS
To start Bro, run the following commands:
/nsm/bro/bin/broctl
install
exitEdit rc.local:
sudo nano /etc/rc.localby adding the following
/nsm/bro/bin/broctl startand then restart the virtual machine
shutdown -r nowWatchDog for Bro IDS
WatchDog automatically starts Bro after a specified period of time in case it crashes:
crontab -e
# add: */5 * * * * /nsm/bro/bin/broctl cronIntel Critical Stack
In order to add Intel Critical Stack to Bro IDS, you need to visit https://intel.criticalstack.com/, create a sensor, and subscribe to feeds. After that, run the following commands on a virtual machine with Bro IDS installed:
curl https://packagecloud.io/install/repositories/criticalstack/critical-stack-intel/script.deb.sh | sudo bashConfigure the sensor with the following commands:
apt-get install critical-stack-intel
critical-stack-intel api <your API key>Check and install updates for receiving feeds:
broctl check
broctl install
broctl restart2. Installing ELK
apt-get updateInstall the Java Development Kit:
apt-get install -y openjdk-8-jdk
apt-get install -y wget apt-transport-https
wget -qO - https://artifacts.elastic.co/GPG-KEY-elasticsearch | sudo apt-key add -
echo "deb https://artifacts.elastic.co/packages/5.x/apt stable main" | sudo tee -a /etc/apt/sources.list.d/elk.list
apt-get updateInstall ElasticSearch:
apt-get install -y elasticsearch
systemctl enable elasticsearch
systemctl start elasticsearchInstall Logstash:
apt-get install -y logstash
systemctl start logstash
systemctl enable logstashInstall and configure Kibana:
apt-get install -y kibana
nano /etc/kibana/kibana.yml
server.host: "0.0.0.0"
systemctl restart kibana
systemctl enable kibanaUse the following commands to configure Logstash:
cd /etc/logstash/conf.d/
wget https://raw.githubusercontent.com/fakrul/bro-elk/master/bro-conn_log.conf
wget https://raw.githubusercontent.com/fakrul/bro-elk/master/bro-dns_log.conf
wget https://raw.githubusercontent.com/fakrul/bro-elk/master/bro-files_log.conf
wget https://raw.githubusercontent.com/fakrul/bro-elk/master/bro-http_log.conf
wget https://raw.githubusercontent.com/fakrul/bro-elk/master/bro-intel_log.conf
wget https://raw.githubusercontent.com/fakrul/bro-elk/master/bro-notice_log.conf
wget https://raw.githubusercontent.com/fakrul/bro-elk/master/bro-ssh_log.conf
wget https://raw.githubusercontent.com/fakrul/bro-elk/master/bro-ssl_log.conf
wget https://raw.githubusercontent.com/fakrul/bro-elk/master/bro-tunnel_log.conf
wget https://raw.githubusercontent.com/fakrul/bro-elk/master/bro-weird_log.conf
wget https://raw.githubusercontent.com/fakrul/bro-elk/master/bro-x509_log.confNOTE: In the conf files, you should change the path to the log files.
Then install the Filter Translate plugin for Logstash:
cd /usr/share/logstash/bin/
logstash-plugin install logstash-filter-translate
systemctl restart logstash3. Configuring Kibana Visualizations
Import the following JavaScript Object Notation (JSON) files into Kibana in order to get the charts we mentioned that visualize suspicious activity on the network.
[
  {
    "_id": "AWHWhw9vuiCz3jvXS1Sb",
    "_type": "visualization",
    "_source": {
      "title": "TOP 10 REMOTE PORTS",
      "visState": "{"title":"TOP 10 REMOTE PORTS","type":"table","params":{"perPage":10,"showPartialRows":false,"showMeticsAtAllLevels":false,"sort":{"columnIndex":null,"direction":null},"showTotal":false,"totalFunc":"sum","type":"table"},"aggs":[{"id":"1","enabled":true,"type":"count","schema":"metric","params":{}},{"id":"2","enabled":true,"type":"terms","schema":"bucket","params":{"field":"id_resp_port.keyword","exclude":"0","size":10,"order":"desc","orderBy":"1","customLabel":"Remote Port"}}],"listeners":{}}",
      "uiStateJSON": "{"vis":{"params":{"sort":{"columnIndex":null,"direction":null}}}}",
      "description": "",
      "version": 1,
      "kibanaSavedObjectMeta": {
        "searchSourceJSON": "{"index":"AWHWHTYfuiCz3jvXGox0","query":{"match_all":{}},"filter":[{"meta":{"index":"AWHWHTYfuiCz3jvXGox0","negate":false,"disabled":false,"alias":null,"type":"phrase","key":"type.keyword","value":"bro-conn_log"},"query":{"match":{"type.keyword":{"query":"bro-conn_log","type":"phrase"}}},"$state":{"store":"appState"}}]}"
      }
    }
  },
  {
    "_id": "AWHXprt1uiCz3jvX3lHz",
    "_type": "visualization",
    "_source": {
      "title": "TOP 10 MALWARE DOMAINS",
      "visState": "{"title":"TOP 10 MALWARE DOMAINS","type":"table","params":{"perPage":10,"showPartialRows":false,"showMeticsAtAllLevels":false,"sort":{"columnIndex":null,"direction":null},"showTotal":false,"totalFunc":"sum","type":"table"},"aggs":[{"id":"1","enabled":true,"type":"count","schema":"metric","params":{}},{"id":"2","enabled":true,"type":"terms","schema":"bucket","params":{"field":"seen.node.keyword","size":10,"order":"desc","orderBy":"1","customLabel":"Malware Domains"}}],"listeners":{}}",
      "uiStateJSON": "{"vis":{"params":{"sort":{"columnIndex":null,"direction":null}}}}",
      "description": "",
      "version": 1,
      "kibanaSavedObjectMeta": {
        "searchSourceJSON": "{"index":"AWHWHTYfuiCz3jvXGox0","query":{"match_all":{}},"filter":[]}"
      }
    }
  },
  {
    "_id": "AWHWRzB1uiCz3jvXLjB9",
    "_type": "visualization",
    "_source": {
      "title": "TOP PROTOCOLS",
      "visState": "{"title":"TOP PROTOCOLS","type":"pie","params":{"addTooltip":true,"addLegend":true,"legendPosition":"right","isDonut":false,"type":"pie"},"aggs":[{"id":"1","enabled":true,"type":"count","schema":"metric","params":{}},{"id":"2","enabled":true,"type":"terms","schema":"segment","params":{"field":"proto.keyword","size":5,"order":"desc","orderBy":"1","customLabel":"Protocol"}}],"listeners":{}}",
      "uiStateJSON": "{}",
      "description": "",
      "version": 1,
      "kibanaSavedObjectMeta": {
        "searchSourceJSON": "{"index":"AWHWHTYfuiCz3jvXGox0","query":{"match_all":{}},"filter":[{"meta":{"index":"AWHWHTYfuiCz3jvXGox0","negate":false,"disabled":false,"alias":null,"type":"phrase","key":"type.keyword","value":"bro-conn_log"},"query":{"match":{"type.keyword":{"query":"bro-conn_log","type":"phrase"}}},"$state":{"store":"appState"}}]}"
      }
    }
  },
  {
    "_id": "AWHWq6wBuiCz3jvXXqYo",
    "_type": "visualization",
    "_source": {
      "title": "BRO LOGS",
      "visState": "{"title":"BRO LOGS","type":"table","params":{"perPage":3,"showMeticsAtAllLevels":false,"showPartialRows":false,"showTotal":true,"sort":{"columnIndex":null,"direction":null},"totalFunc":"sum","type":"table"},"aggs":[{"id":"1","enabled":true,"type":"count","schema":"metric","params":{"customLabel":"# OF RECORDS"}},{"id":"2","enabled":true,"type":"terms","schema":"bucket","params":{"field":"type.keyword","include":"","size":5,"order":"desc","orderBy":"1","customLabel":"LOG FILES"}}],"listeners":{}}",
      "uiStateJSON": "{"vis":{"params":{"sort":{"columnIndex":null,"direction":null}}}}",
      "description": "",
      "version": 1,
      "kibanaSavedObjectMeta": {
        "searchSourceJSON": "{"index":"AWHWHTYfuiCz3jvXGox0","query":{"match_all":{}},"filter":[{"meta":{"index":"AWHWHTYfuiCz3jvXGox0","type":"phrases","key":"type","value":"bro-conn_log, bro-http_log, bro-intel_log","params":["bro-conn_log","bro-http_log","bro-intel_log"],"negate":false,"disabled":false,"alias":null},"query":{"bool":{"should":[{"match_phrase":{"type":"bro-conn_log"}},{"match_phrase":{"type":"bro-http_log"}},{"match_phrase":{"type":"bro-intel_log"}}],"minimum_should_match":1}},"$state":{"store":"appState"}}]}"
      }
    }
  },
  {
    "_id": "AWHWTDyouiCz3jvXMHmd",
    "_type": "visualization",
    "_source": {
      "title": "TOP 10 TALKERS",
      "visState": "{"title":"TOP 10 TALKERS","type":"histogram","params":{"grid":{"categoryLines":false,"style":{"color":"#eee"},"valueAxis":"ValueAxis-1"},"categoryAxes":[{"id":"CategoryAxis-1","type":"category","position":"bottom","show":false,"style":{},"scale":{"type":"linear"},"labels":{"show":true,"truncate":0},"title":{"text":""}}],"valueAxes":[{"id":"ValueAxis-1","name":"LeftAxis-1","type":"value","position":"left","show":true,"style":{},"scale":{"type":"linear","mode":"normal"},"labels":{"show":true,"rotate":0,"filter":false,"truncate":100},"title":{"text":"Count"}}],"seriesParams":[{"show":"true","type":"histogram","mode":"normal","data":{"label":"Count","id":"1"},"valueAxis":"ValueAxis-1","drawLinesBetweenPoints":true,"showCircles":true}],"addTooltip":true,"addLegend":true,"legendPosition":"right","times":[],"addTimeMarker":false,"type":"histogram","orderBucketsBySum":false},"aggs":[{"id":"1","enabled":true,"type":"count","schema":"metric","params":{}},{"id":"2","enabled":true,"type":"terms","schema":"group","params":{"field":"id_orig_host.keyword","size":10,"order":"desc","orderBy":"1","customLabel":"Host"}}],"listeners":{}}",
      "uiStateJSON": "{}",
      "description": "",
      "version": 1,
      "kibanaSavedObjectMeta": {
        "searchSourceJSON": "{"index":"AWHWHTYfuiCz3jvXGox0","query":{"match_all":{}},"filter":[{"meta":{"index":"AWHWHTYfuiCz3jvXGox0","negate":false,"disabled":false,"alias":null,"type":"phrase","key":"type.keyword","value":"bro-conn_log"},"query":{"match":{"type.keyword":{"query":"bro-conn_log","type":"phrase"}}},"$state":{"store":"appState"}}]}"
      }
    }
  },
  {
    "_id": "AWHWRA0BuiCz3jvXLG2E",
    "_type": "visualization",
    "_source": {
      "title": "CONNECTIONS COUNT PER MINUTE",
      "visState": "{"title":"CONNECTIONS COUNT PER MINUTE","type":"line","params":{"addLegend":true,"addTimeMarker":false,"addTooltip":true,"categoryAxes":[{"id":"CategoryAxis-1","labels":{"show":true,"truncate":0},"position":"bottom","scale":{"type":"linear"},"show":true,"style":{},"title":{"text":"@timestamp per minute"},"type":"category"}],"grid":{"categoryLines":true,"style":{"color":"#eee"},"valueAxis":"ValueAxis-1"},"legendPosition":"top","seriesParams":[{"show":true,"mode":"normal","type":"line","drawLinesBetweenPoints":true,"showCircles":true,"data":{"id":"3","label":"Count"},"valueAxis":"ValueAxis-1"}],"times":[],"type":"line","valueAxes":[{"id":"ValueAxis-1","labels":{"filter":false,"rotate":0,"show":true,"truncate":100},"name":"LeftAxis-1","position":"left","scale":{"mode":"normal","type":"linear"},"show":true,"style":{},"title":{"text":"Count"},"type":"value"}]},"aggs":[{"id":"2","enabled":true,"type":"date_histogram","schema":"segment","params":{"field":"@timestamp","interval":"m","customInterval":"2h","min_doc_count":1,"extended_bounds":{}}},{"id":"3","enabled":true,"type":"count","schema":"metric","params":{}}],"listeners":{}}",
      "uiStateJSON": "{}",
      "description": "",
      "version": 1,
      "kibanaSavedObjectMeta": {
        "searchSourceJSON": "{"index":"AWHWHTYfuiCz3jvXGox0","query":{"match_all":{}},"filter":[{"meta":{"index":"AWHWHTYfuiCz3jvXGox0","negate":false,"disabled":false,"alias":null,"type":"phrase","key":"type.keyword","value":"bro-conn_log"},"query":{"match":{"type.keyword":{"query":"bro-conn_log","type":"phrase"}}},"$state":{"store":"appState"}}]}"
      }
    }
  },
  {
    "_id": "AWHWefVTuiCz3jvXRbLT",
    "_type": "visualization",
    "_source": {
      "title": "TOP 10 HTTP REQUESTS",
      "visState": "{"title":"TOP 10 HTTP REQUESTS","type":"histogram","params":{"grid":{"categoryLines":false,"style":{"color":"#eee"},"valueAxis":"ValueAxis-1"},"categoryAxes":[{"id":"CategoryAxis-1","type":"category","position":"bottom","show":false,"style":{},"scale":{"type":"linear"},"labels":{"show":true,"truncate":0,"filter":false},"title":{"text":""}}],"valueAxes":[{"id":"ValueAxis-1","name":"LeftAxis-1","type":"value","position":"left","show":true,"style":{},"scale":{"type":"linear","mode":"normal"},"labels":{"show":true,"rotate":0,"filter":false,"truncate":100},"title":{"text":"Count"}}],"seriesParams":[{"show":"true","type":"histogram","mode":"normal","data":{"label":"Count","id":"1"},"valueAxis":"ValueAxis-1","drawLinesBetweenPoints":true,"showCircles":true}],"addTooltip":true,"addLegend":true,"legendPosition":"right","times":[],"addTimeMarker":false,"type":"histogram","orderBucketsBySum":false},"aggs":[{"id":"1","enabled":true,"type":"count","schema":"metric","params":{}},{"id":"2","enabled":true,"type":"terms","schema":"group","params":{"field":"referrer.keyword","exclude":"-","size":10,"order":"desc","orderBy":"1","customLabel":"HTTP Host"}}],"listeners":{}}",
      "uiStateJSON": "{}",
      "description": "",
      "version": 1,
      "kibanaSavedObjectMeta": {
        "searchSourceJSON": "{"index":"AWHWHTYfuiCz3jvXGox0","query":{"match_all":{}},"filter":[{"meta":{"index":"AWHWHTYfuiCz3jvXGox0","negate":false,"disabled":false,"alias":null,"type":"phrase","key":"type.keyword","value":"bro-http_log"},"query":{"match":{"type.keyword":{"query":"bro-http_log","type":"phrase"}}},"$state":{"store":"appState"}}]}"
      }
    }
  }
]4. Configuring the Kibana Dashboard
The following JSON file describes in what order charts will be displayed on the dashboard:
[
  {
    "_id": "AWHXaEbeuiCz3jvXvitY",
    "_type": "dashboard",
    "_source": {
      "title": "Statistics Dashboard",
      "hits": 0,
      "description": "",
      "panelsJSON": "[{"col":1,"id":"AWHWRA0BuiCz3jvXLG2E","panelIndex":1,"row":1,"size_x":12,"size_y":3,"type":"visualization"},{"col":1,"id":"AWHWRzB1uiCz3jvXLjB9","panelIndex":2,"row":4,"size_x":4,"size_y":3,"type":"visualization"},{"col":5,"id":"AWHWTDyouiCz3jvXMHmd","panelIndex":3,"row":4,"size_x":4,"size_y":3,"type":"visualization"},{"col":9,"id":"AWHWefVTuiCz3jvXRbLT","panelIndex":4,"row":4,"size_x":4,"size_y":3,"type":"visualization"},{"col":1,"id":"AWHWhw9vuiCz3jvXS1Sb","panelIndex":5,"row":7,"size_x":4,"size_y":5,"type":"visualization"},{"col":5,"id":"AWHWq6wBuiCz3jvXXqYo","panelIndex":6,"row":7,"size_x":4,"size_y":5,"type":"visualization"},{"col":9,"id":"AWHXprt1uiCz3jvX3lHz","panelIndex":7,"row":7,"size_x":4,"size_y":5,"type":"visualization"}]",
      "optionsJSON": "{"darkTheme":false}",
      "uiStateJSON": "{"P-5":{"vis":{"params":{"sort":{"columnIndex":null,"direction":null}}}},"P-6":{"vis":{"params":{"sort":{"columnIndex":null,"direction":null}}}},"P-7":{"vis":{"params":{"sort":{"columnIndex":null,"direction":null}}}}}",
      "version": 1,
      "timeRestore": false,
      "kibanaSavedObjectMeta": {
        "searchSourceJSON": "{"filter":[{"query":{"match_all":{}}}],"highlightAll":true,"version":true}"
      }
    }
  }
]Everything is set up! You’re ready to monitor network activities.
Conclusion
In this article, we described a method for analyzing network activities with open source tools, in particular by integrating BRO IDS with Intel Critical Stack.
This method is effective for detecting infected computers and doesn’t require any investments from small enterprises except labor costs to set it up.
We also provided recommendations on how to configure Bro and Critical Stack Agent for network monitoring and data collection. Finally, we explained how we used the ELK Stack for visualizing data and interpreting charts.
Our Network Testing Team has vast experience interpreting network processes. We would be glad to assist you in testing your own network management solutions.
References:
https://en.wikipedia.org/wiki/Intrusion_detection_system
https://intel.criticalstack.com/
Download examples of JSON files:
Have a question?
Ask our expert!
Program Manager


