 Skip to main content
Analyzing physical memory dumps helps you find bugs, viruses, and malware. Operating systems always create volatile dump files when they crash, and these files contain information that can be useful in determining why the system went down.
Moreover, analyzing RAM dumps can be useful for improving system performance and collecting evidence of cyber crimes.
In this article, we share our experience conducting physical memory dump analysis using the Volatility Framework. This article will be helpful for developers who need to analyze RAM images and are considering using Volatility.
Contents:
What are volatile memory, volatile data, and memory dumps?
Volatile memory is computer memory that requires an electrical current to retain data. When the power is turned off or the system shuts down for any reason, all data stored in volatile memory (i.e. all volatile data) is erased.
Volatile data can include browsing history, chat messages, and other application information that is often not stored elsewhere on the device and is unlikely to be recoverable. The most common type of volatile memory is random-access memory, or RAM.
RAM stores information about the current state of all running processes and services (both system-level and user-level). Due to constantly changing data, it’s impossible to work with RAM directly. Therefore, data stored in RAM can only be accessed as an image.
Memory dumps are files that contain a copy of a computer’s volatile memory at a specific time — generally, when the system crashes. A memory dump can also be defined as the process of taking all information contained in RAM and writing it to a storage drive.
A memory dump with captured RAM can be used to find information about running programs and the operating system itself.
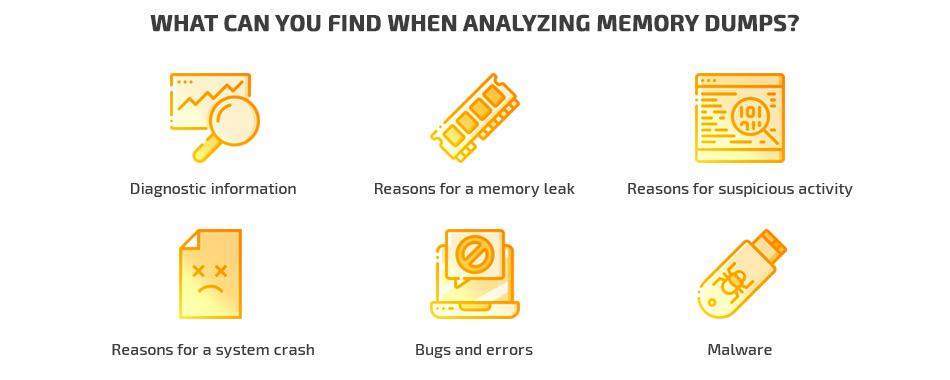
Developers usually analyze memory dumps to:
- Gather diagnostic information
- Find out the reasons for a system crash
- Find out the reasons for memory leaks, bugs, and errors
- Find out the reasons for suspicious activities (for example, malware)
Memory dump analysis is widely used in computer forensics. The goal of this field is to capture and collect digital information found on computers and digital storage media and identify whether that information can be used as evidence in legal cases. Organizations often use computer forensics as an element of the defense in depth approach to network security. For instance, organizations may use knowledge of the legal and technical aspects of computer forensics to figure out whether their network has been compromised.
There are several popular tools for analyzing RAM images, including Redline, SANS SIFT, Rekall Forensics, and MemGator. To show you an example of how to analyze physical memory dumps, we’ve chosen the Volatility Framework. Let’s explore the pros and cons of this tool.
Need help creating reliable and secure software?
Deliver a protected and efficient product by leveraging Apriorit’s expertise in cybersecurity development, security testing, and penetration testing.
Volatility Framework: pros and cons
Let’s say you’ve located malware activity in a computer’s RAM. Modern computer viruses don’t store data on hard drives. Instead, they live in RAM, which contains continuously changing data about open network connections, file descriptors (handlers), libraries, running processes, etc.
Thus, it can be challenging or sometimes even impossible to detect and eliminate malware using conventional antivirus software. What you can do is use a parsed memory image taken at the time of a suspicious activity to conduct a full analysis and detect a virus. But to do that, you need to find a tool to analyze this data.
For this article, we’ve chosen the Volatility Framework because it’s an open-source project with a large community and a significant number of plugins that cover everything you need for volatile memory dump analysis.
Basic information that can be retrieved using the Volatility Framework:
- Date and time of the captured image
- Running processes
- Open network sockets
- Open network connections
- Loaded libraries for each process
- Open file names for each process
- Memory addresses
- Operating system kernel modules
- Mapping of physical offsets to virtual addresses
The Volatility Framework is currently one of the most popular tools for volatile memory analysis. This cross-platform framework allows you to work with images of volatile memory, analyze them, obtain data on past states of the system from them, and more.
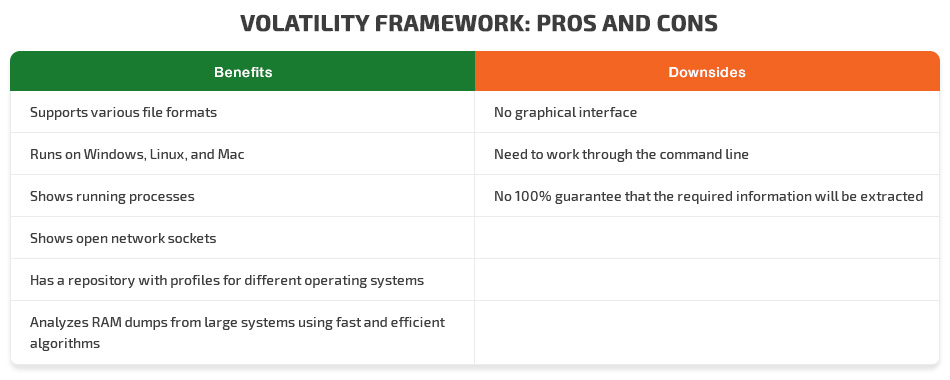
The major downside of working with Volatility is the absence of a graphical interface, as it can be inconvenient to work through the command line. Also, RAM is a dynamically changing object. Therefore, there’s always a chance that you’ll get an inconsistent data state in a memory dump, leading to the inability to parse this data. So there’s no 100% guarantee that Volatility can extract a certain file from memory dump.
Still, the Volatility Framework has lots of advantages. For instance, this tool:
- Runs on Windows, Linux, and Mac
- Supports various file formats
- Comes with fast and efficient algorithms to analyze RAM dumps from large systems
- Has a large repository that stores profiles for different operating systems
- Shows a list of running processes and open network sockets
More detailed documentation and a list of plugins can be found on the official website and on the project’s GitHub page. Now let’s explore how to perform memory analysis using Volatility Framework.
Related project
Improving a SaaS Cybersecurity Platform with Competitive Features and Quality Maintenance
Explore how Apriorit’s development efforts helped our client make their SaaS cybersecurity platform more stable and competitive. Read the full text to unveil the details of implementing new features in a low-level vulnerability detection engine and introducing quick bug fixes.

Analyzing physical memory dumps with Volatility
To work with the Volatility Framework, you need Python 2.6 or higher. Python is installed by default on the majority of Unix systems, but it’s easy to install it on Windows as well. To get the latest version of the Volatility Framework, download the latest sources using the git clone command or download them as a ZIP archive.
After installing Volatility, you can start working with RAM images. When analyzing data from an image, it’s necessary to use a profile for the particular operating system. A profile is a collection of data that consists of structural data, algorithms, and symbols used in a specific operating system’s kernel.
In Windows systems, profiles are stored in the source code, so you don’t have to perform any additional manipulations. For Unix systems, you have to create profiles on your own. Because of the large number of unique kernel assemblies, it’s impossible to prepare a dataset for all possible options.
You can find out more about creating Unix system profiles for Linux and macOS on the Volatility GitHub pages:
Let’s see how to use Volatility in Windows.
1. Identifying the system profile
To get started, we need to understand which system the dump has been taken from. This can be done using the imageinfo plugin. Execute the following request from the directory that contains the Volatility sources:
python vol.py -f %image_name% imageinfoThe screenshot below shows the output of this command:
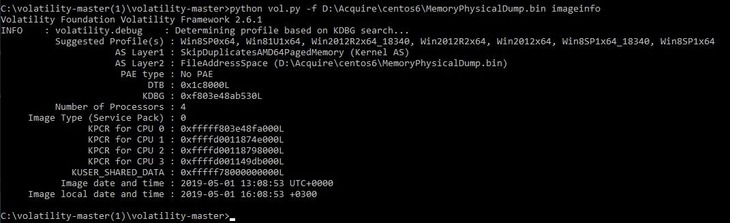
In this case, we need to pay attention to the following fields:
Suggested Profile(s)— A list of likely operating systems from which the image was takenAS Layer2: FileAdressSpace— A path to the analyzed physical memory imageImage date and time— The date and time at which the image was taken (UTC)Image local date and time— The local time at which the image was captured
In our case, the version of the operating system is Windows Server 2012 R2 x64. This was suggested by Volatility, but not as the first option. Unfortunately, due to the principles of RAM operation, we can’t 100% accurately determine the system’s profile from working with the memory image. Since RAM is constantly changing, its image may not be recognized as valid by the tool at some point in time. Unfortunately, there are no tools that can more reliably do the job.
Read also
Anti Debugging Protection Techniques with Examples
Use the power of anti debugging to shield your software. Explore our extensive guide with practical examples of applying the best anti-debugging techniques from Apriorit experts.

2. Calling the list of all processes
Let’s continue our dump analysis. Once we get a physical memory dump from a PC that has experienced an incident, we can analyze all running processes to find suspicious ones.
A list or tree of processes will show us the child processes of all parent processes. Then we can load a memory dump of a particular process and analyze what it was doing on the PC.
With Volatility, we can list all running processes using the pslist and pstree plugins. The pstree plugin shows a list of active processes in the form of a tree and is more detailed than pslist, which shows the linking of a process with its parent process.
To illustrate this, let’s see the results of the same request using both plugins:
python vol.py -f %path_to_image% --profile=%profile_name% pstree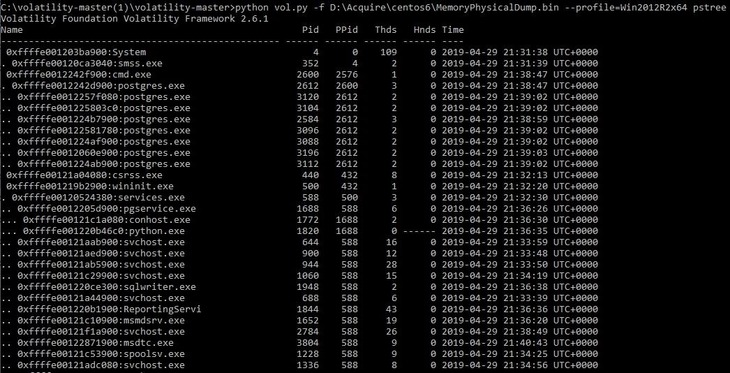
The -f flag is needed to specify the path to the RAM dump:
python vol.py -f %path_to_image% --profile=%profile_name% pslist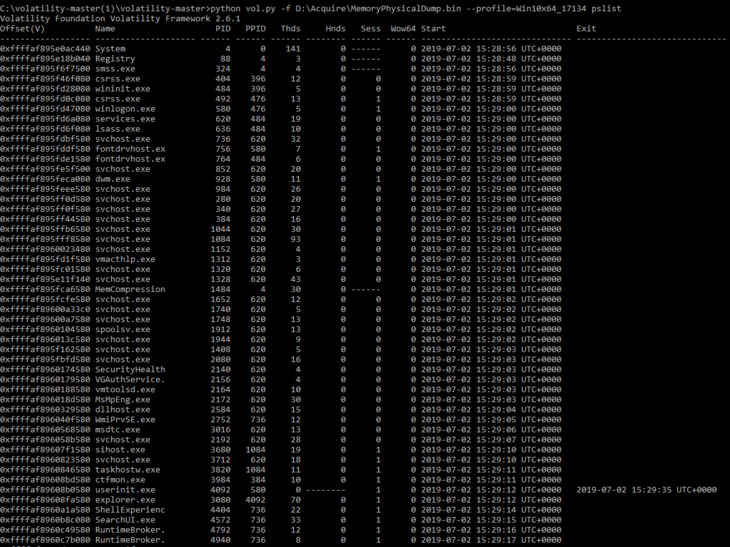
Although this way of calling the list allows us to see all processes, we can’t know the inheritance between parents and children. Therefore, we can’t see which process triggered the suspicious activity.
Apart from plugins for viewing a list of all processes, Volatility includes lots of other helpful plugins. You can call a list of all of them using the –info command:
python vol.py --infoThe output of this command includes a list of available profiles for various operating systems, a list of available address spaces, and a list of plugins.
Volatility 2.6.1 has more than 250 plugins. For example, there’s the clipboard plugin that extracts the contents of the Windows clipboard and the handles plugin that prints a list of open handles for each process.
Related project
Developing a Custom Secrets Management Desktop Application for Secure Password Sharing and Storage
Explore the success story of developing a custom secrets management desktop application. Find out how Apriorit helped our client receive an efficient solution for safeguarding their sensitive information and improve the company’s overall security score by 30%.

3. Finding a list of used dynamic-link libraries
If we need to see the actions of a process, it’s much faster to view the list of libraries than to load the RAM image. The list of libraries can help us make assumptions about which manipulations with the system were performed by a particular process. Then we can decide whether to conduct further analysis.
Now let’s find the list of used dynamic-link libraries (dlls) from the postgres.exe process with the Process ID 2612 (PID 2612) by running the dlllis plugin. For this example, we’ve randomly chosen PID 2612, which isn’t a system process, from the list the postgres.exe processes.
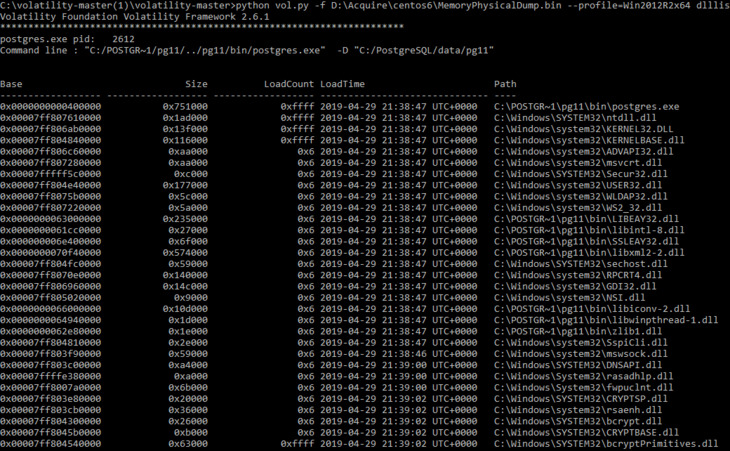
For a more detailed analysis of this process, you can load the entire allocated memory used by this process from the original RAM image.
To do this, use the memdump plugin:
python vol.py –f% image_name% memdump –p 2612 --dump =% dump_directory%The -f flag indicates the path to the file. The -p flag indicates the required PID. After saving, we get a .dmp file that can be analyzed with any decompiler.
Analyzing RAM dumps for Unix systems is almost the same, except for the method of obtaining the profiles with which we’ll parse images. Due to the large number of kernel assemblies even for some of the most popular distributions, it would be challenging to create ready-made profiles as exist for Windows.
By getting physical memory dumps and using the Volatility Framework to analyze them, you can:
- Conduct analysis at any time, even after an incident
- Analyze physical memory dumps without affecting system availability
- Find additional evidence of malicious activity in the memory image if you have already noticed suspicious processes (for example, processes accessing system files or shady IP addresses)
If any malicious process is detected after taking the steps described above, this information will give you a hint as to which files, processes, connections, or handlers it may affect.
Conclusion
In this article, we explored how to use Volatility for memory analysis and interact with images of physical memory. This framework allows us to find out which processes run on a computer at a certain point in time — other tools like Process Explorer and its analogs can’t do that.
Memory images show the complete state of the system at the time they were taken, and they can’t be changed. Thus, Volatility can be applied to find malware, bugs, errors, and reasons for system crashes as well as to use all obtained data as digital evidence in investigating crimes related to computer information.
Gathering software engineers with relevant skills and experience is vital for ensuring the proper quality of your systems. At Apriorit, we have professional developers with strong expertise in cybersecurity, security testing, and data processing technologies ready to help you with projects of any complexity.
Want to enhance your system’s protection?
Improve your solution’s competitiveness and reliability by delegating your technical tasks to Apriorit’s cybersecurity and penetration testing experts.
Have a question?
Ask our expert!
VP of Innovation and Technology, Canada Branch Director


