Performance testing helps you get lots of insights like how your software handles high loads and large numbers of users.
In this article, we discuss the importance of performance testing, go over performance testing methodology, its main stages, and review three commonly used performance testing tools. This article will be useful for quality assurance (QA) specialists looking for ways to improve their performance testing routines.
Contents:
What is performance testing and why do you need it?
Performance testing measures the processing speed, bandwidth, reliability, and scalability of a desktop or web application under some load. Performance testing is focused on parameters such as:
- Application response time
- Maximum possible load
- Stability under different loads
The purpose of performance testing is not to find bugs but to check if the system can handle expected continuous or peak loads and to detect and remove performance bottlenecks.
Application performance testing allows you to:
- Make sure if the product under test is ready for release
- Estimate performance parameters and resource requirements
- Compare the performance of particular systems or configurations
- Discover the causes of performance losses
- Find ways to improve the product
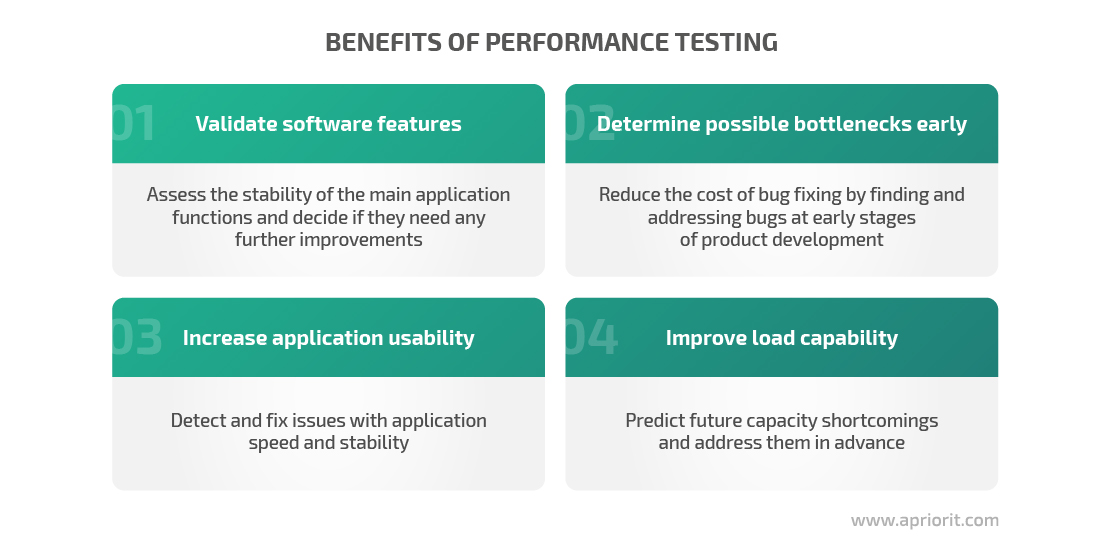
Moreover, conducting performance testing at different stages of application development gives you a variety of benefits:
There are several types of performance testing, each of which is used to achieve a specific testing goal.
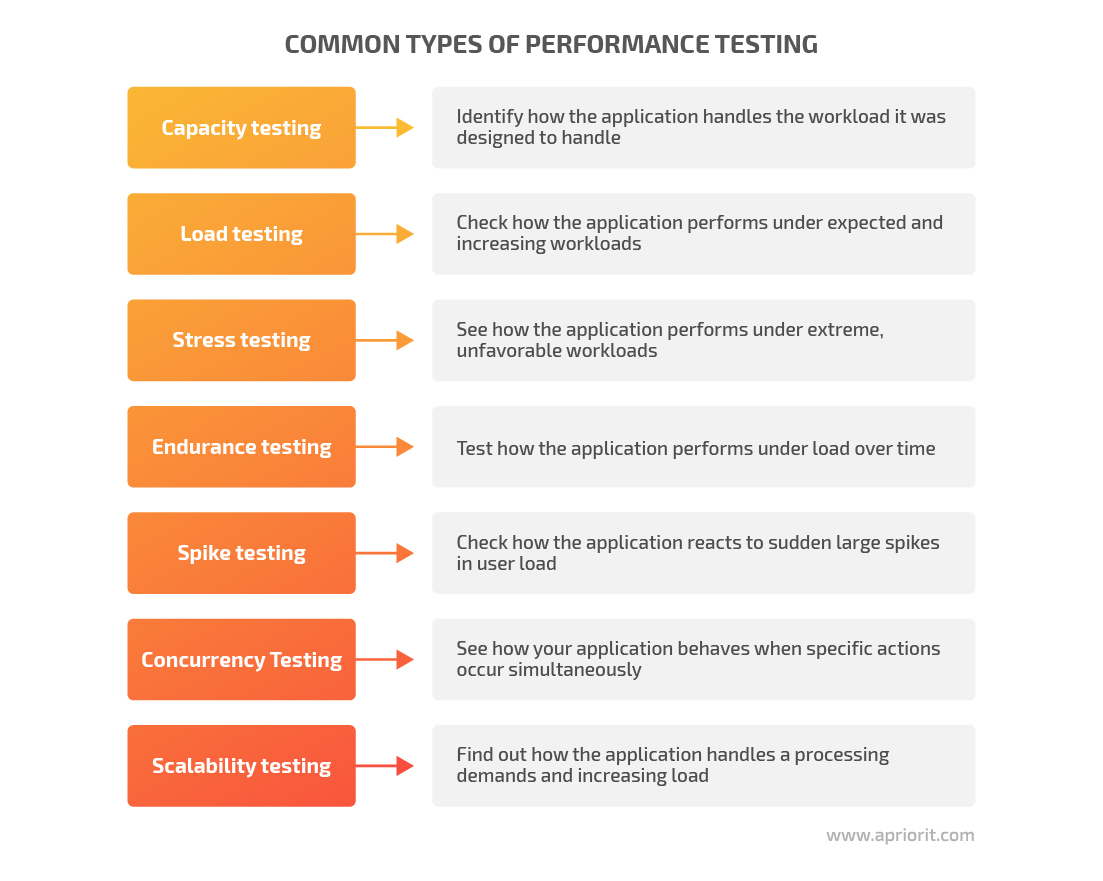
As you can see, each type of performance testing is aimed at detecting a particular issue. When choosing a performance testing type, rely on the product features, objectives, and stage of testing. A combination of testing types will give you the best results.
Main stages of performance testing
To ensure a positive result and rational use of resources, our QA team usually breaks performance testing into the following stages:
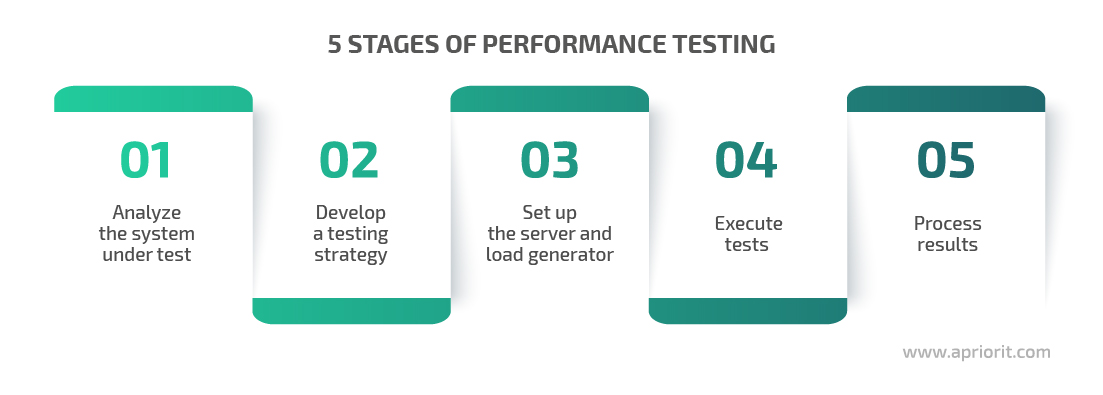
1. Analyze the system under test
At this stage, you can gather and analyze information about the system’s properties, features, and mode of operation. This knowledge will you:
- Determine user behavior patterns
- Determine a load profile
- Determine the required amount of test data
- Identify potential weaknesses of the system based on its technology set and architecture
- Define system monitoring methods
The main goal at this stage is to define the metrics that the system must meet. QAs will then use these metrics to evaluate system performance. The final choice of the performance testing metrics and the testing approach always depends on the project at hand. We’ll get back to this matter later in the article.
For instance, at Apriorit, we use different approaches to testing public and internal APIs. Usually, we check an API’s performance by emulating a large number of concurrent requests, like 10,000 users attempting to log in to the system. But in the case of internal API testing, such tests will be redundant, because only one component works with the internal API at a time. Therefore, we check:
- memory leaks during cyclic execution of the same request
- processing speed for large artifacts — large files, RAM images, disks
- memory consumption — how much CPU, RAM, and disk space the API will consume while processing large artifacts
2. Develop a test strategy
Based on information obtained during the analysis phase, you can create a performance testing strategy. This strategy usually covers the test environment, testing tools and approaches, exit criteria, and the load profile. Let’s look closer at each of these components.

Test environment
Define a physical environment for testing and deploying the project. The physical environment includes software, hardware, and network configuration.
The ideal case is when the performance testing environment and deployment environment are identical. But in real life, the testing environment is usually less performant than the production environment. To get the most relevant results, you can use the stand correspondence coefficient. It is the numerical difference between the performance of the test and the production environment.
For example, you might not have a product’s physical deployment environment available, but you can get its characteristics from the vendor’s technical documentation, expert reviews, etc. Using performance testing tools, you can then calculate the performance of the test infrastructure. Based on the obtained results, you can determine the difference between the performance of the test and deployment configurations. This difference coefficient allows you to predict the performance of the production environment.
Testing tools and approaches
Select the performance testing tools and approaches based on the application’s features, platforms, and programming language.
Exit criteria
Define what system parameters you want to measure and the results you need to obtain to finish testing. Here are the most important performance testing parameters:

You check different exit criteria at different testing phases, and at the end of the testing cycle, your product should meet all specified exit criteria. Otherwise, you should fix the application’s issues and then repeat all the tests.
Load model
The load model shows how a system will behave under different loads.
At Apriorit, we build a load model based on customer requirements for expected or actual load, the actual number of users in the system, and our analysis of system use scenarios.
Say there’s a load model for a system with a web interface that gives users access to remote applications on a server. There are 100 users and five system administrators connected to the application. Administrators add and remove users and allow or block access to the application. Every hour, five users are added or removed and permissions are changed for 20 applications. Let’s distribute the tasks among the administrators so that only one of them works with user logins and the other four process access permissions. In this case, the intensity of operations for the first administrator will be five add or delete operations per hour, and for the other four admins the workload will be five change operations per hour.
Read also:
Mobile Application Testing Overview: Testing Types, Checklists, and Virtualization Services
3. Set up the server and load generator
You can install tools needed to execute performance testing on a load generator, which is a virtual or physical machine that should be located as close to the application server as possible. To simulate a large number of users and generate a lot of traffic, you can perform distributed load testing. With this type of testing, you can run tests on several different computers, which is necessary when one machine is not able to create enough load.
When doing any kind of load testing, ensure that server metrics are simple and constant. There are different tools for this purpose such as Nmon, PerfMon, Zabbix, and Grafana.
At Apriorit, we use Grafana because it not only allows for constant monitoring of server parameters but includes powerful visualization functions.
We combine JMeter and Grafana with the InfluxDB platform and Telegraf server agent to:
- Collect and retrieve statistics in real time on:
- The server-side (CPU, memory, network, disk)
- The client-side (time to the first byte, CPU idle time, payload)
- The application side (response time, error rate, throughput)
- Create interactive graphics and metrics
- Save test results, access different runs, and sharing
- Monitor histories and trends, and compare results of multiple test sessions
- Use continuous integration to run tests
- Receive alerts
Combining these tools, you can get the most tangible results after executing performance tests so you don’t have to spend extra time collecting and analyzing the results.
Read also:
Automotive Cybersecurity Testing 101: Requirements, Best Practices, Tips on Overcoming Challenges
4. Execute performance tests
This stage includes several steps:
- Preparing test data: you can use code, SQL and API requests, and the interface.
- Developing load scripts: record user actions, develop test code, and group tests in the sets to be executed.
- Pre-running tests: check if the prepared scripts work correctly and to find the optimal load model.
- Conducting tests: start tests, monitor them running, and gather testing results.
5. Process reports
The final stage of performance testing is analyzing results and creating a final report.
Test reports usually include the following information:
- The purpose of testing
- Configuration of the test bench and load generator
- Software requirements
- User behavior scenarios and load profile
- Statistics on key performance characteristics like response time, number of requests per second, and number of transactions per second
- Data on the maximum possible number of concurrent users at which the solution will cope with the load
- Information about the number and types of HTTP errors
- Graphs showing the dependence of system performance on the number of simultaneously working users
- Conclusions about the performance of the system as a whole and weaknesses, if identified
- Recommendations for improving software performance
After testing and analyzing the results, you can decide whether the product is ready to be released to the market. If you identified some severe issues, it’s better to fix the weak spots and repeat the tests to make sure that the application’s performance is enhanced before the product release.
How to conduct performance testing
In this section, we describe how to conduct performance testing, what metrics you can choose, as well as challenges that can arise during performance testing.
When to conduct performance testing
At Apriorit, we follow three basic principles for planning performance testing:

Let’s look closer at how these principles help us get the most benefits from performance testing best practices:
1. Start performance testing as early as possible. The cost of fixing performance issues increases as development progresses. Our QA experts usually participate in requirement discussions and help the product team select performance testing tools that comply with the project’s objectives.
It’s necessary to determine the load that the application should be able to handle at early stages. After that, we test the underlying technology: network load balancer, database, and web servers. In this way, we can optimize the server and prevent possible future expenses or sales reductions.
2. Engage developers in performance testing. At Apriorit, programmers also can access testing tools to check their code performance and search for concurrency issues. Thus, they can identify and fix performance issues early at the implementation stage. For example, there could be issues due to database locks. Using the JMeter performance testing tool, we can configure the right number of parallel connections to the database.
Following this principle, each developer is responsible not only for app functionality but also for code performance. This allows us to detect performance issues before actual code testing.
3. Regularly conduct performance testing of each application build. Once the product enters the testing stage, QA engineers perform the first load tests. From that point on, performance testing becomes a part of the software build’s daily testing routine.
For each feature, we allocate enough time for the relevant type of performance testing. This allows us to avoid negative changes in the application performance and check the application’s performance against acceptance criteria.
You may also want to test the performance of an already developed product to identify weaknesses, determine the potential for increasing the number of users, planned monitoring, etc.
What metrics do you need for performance testing?
To make the performance testing process as effective and useful as possible, you need to select specific metrics or indicators.
Sometimes, clients approach us with a set of metrics determined during a previous testing session. In such situations, our QA engineers validate these metrics based on an analysis of the system and provide recommendations for adjustments if necessary.
Below are the most frequently used performance metrics.
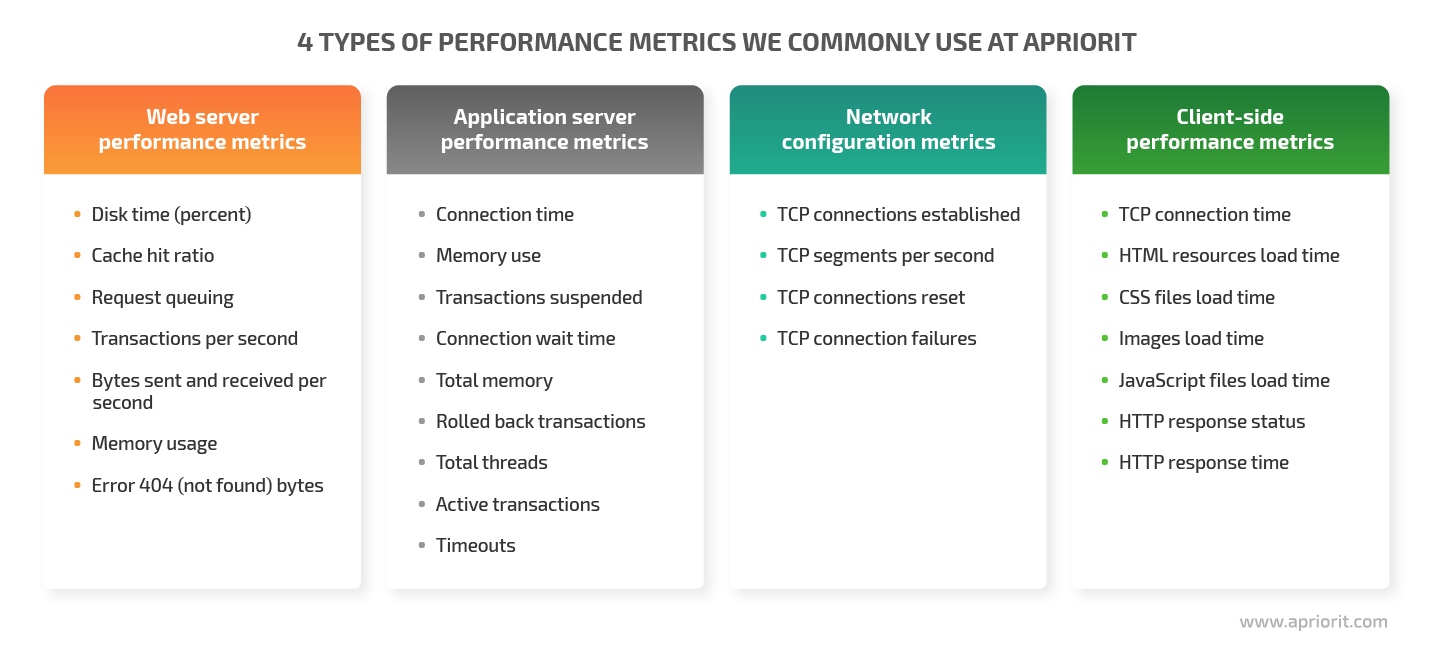
Web server performance metrics. These metrics provide useful information about web server performance, such as resource use on the server during test execution. We choose performance metrics depending on which server our system uses.
Application server performance metrics. Since most application activities are performed on the application server, it’s important to monitor the performance metrics of the application server when running tests.
Network configuration metrics. A web product won’t perform consistently and efficiently if its network isn’t designed properly. During performance testing, you need to monitor the latency of each segment of your application’s network.
Client-side performance metrics. It‘s important to monitor the performance metrics of the client part of the application because it has to handle the maximum load.
In most cases, our QA team determines a list of necessary metrics based on testing goals. These metrics are a handy tool for tracking the dynamics of performance changes.
What kinds of challenges to expect during performance testing
Performance testing is quite a complex process. There are many aspects you need to consider when planning and executing performance tests to get the best results. Below are major performance testing challenges you may encounter during your performance testing.
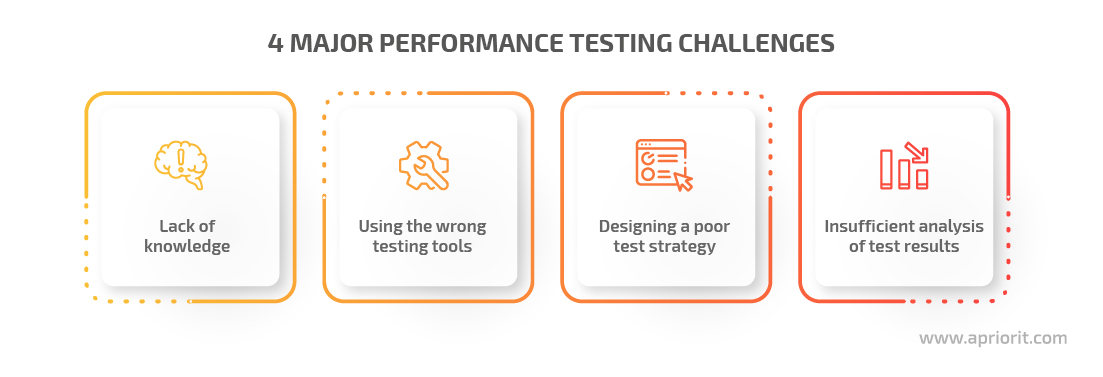
1. Lack of knowledge
Different mistakes can lead to inaccurate data in the test report and the need to spend more time on performance testing. For example, while planning testing activities, it’s possible to miss or fail to prioritize any of the important performance testing steps. You can also define the wrong metrics, select the wrong tools, or wrong testing environment.
In order to avoid this, make sure to constantly check and update your knowledge in various QA procedures. Also, it’s a good practice to schedule time for an in-depth and relevant study when you’re about to work on a new specific project.
2. Using the wrong testing tools
Choosing the wrong testing tools can result in running inappropriate tests for some features, leading to inaccurate results and too much time spent on running additional tests. In such a case, you risk delivering a low-quality product.
When choosing the right tool, it’s crucial to consider multiple factors, including:
- The tool’s functionality
- The tool’s ability to work with the configurations required for testing of the particular application
- The QA’s experience and skills
- The cost of implementation
3. Designing a poor testing strategy
The testing strategy determines application performance metrics, necessary tests, exit criteria, testing tools, and the testing environment. Without this information, you may conduct performance testing tasks inefficiently. For example, you may not spend enough time thoroughly testing the application in a specific environment. As a result, the performance testing won’t be efficient, and sometimes you won’t receive important information about performance issues.
Therefore, when planning testing, pay special attention to the application’s architecture and the performance testing requirements of the particular product. This knowledge will help you better understand the testing goals and build a relevant testing strategy.
4. Insufficient analysis of test result
Proper analysis of the obtained test results allows you to identify possible performance issues. Based on analysis data, the QA team can:
- Decide how to fix possible weaknesses
- Choose additional metrics or tools to apply to eliminate the problem
- Estimate the time needed to allocate for this activity
- Determine how much application performance has improved
If test analysis is incomplete or incorrect, it can lead to a number of problems. For example, some performance issues will constantly appear and require additional time to fix, which may significantly delay the release of the product to market. Also, some flaws will simply not be detected, and end users will receive a poor quality product.
To avoid this, it’s essential to take enough time to analyze the test results. Also, you might want to choose a tool that provides extremely detailed reports.
How to choose the right performance testing tool
Tool selection is one of the key tasks when developing a testing strategy. A good practice is to choose performance testing tools individually for each particular project.
Here are the main criteria for choosing the right performance testing tool:

Let’s explore major questions that will help you choose the most suitable testing tool:
Does this tool meet your configuration requirements? Pay special attention to the compatibility of the performance testing tool with other applications, programming languages, and operating systems this particular tool can work with.
What features does this performance testing tool have? The most useful features of a performance testing tool are:
- The possibility to generate a required load
- The opportunity to perform testing with several physical machines that can emulate user actions
- Functionality to gather necessary information about test results and the tested system’s state
- Functionality to run tests using continuous integration
What types of test reports do you need to receive? Pay attention to the tools that can help you obtain informative and understandable reports and analyze them carefully. Tools for automated testing can enable you to:
- Obtain statistics from application servers
- Get real-time statistics
- Obtain error descriptions
- Receive notifications
- Monitor history and trends
- Compare multiple results of test sessions
- Obtain specific values at specific time periods using interactive graphics
Does your team have any experience working with this performance testing tool? If your QA testing team is going to work with a tool they have never worked with before, make sure to schedule time for education.
How much does it cost to implement this tool? Check whether the tool is free or requires a license. In addition, you can calculate the costs for learning the tool if you have little experience working with it.
In the next section, we introduce you to the top three testing tools our QA team has chosen based on their experience with different projects.
Top 3 performance testing tools
Below we list the top three tools we use at Apriorit for performance testing. We describe their main features, pros, and cons to help you decide if they would fit your project.
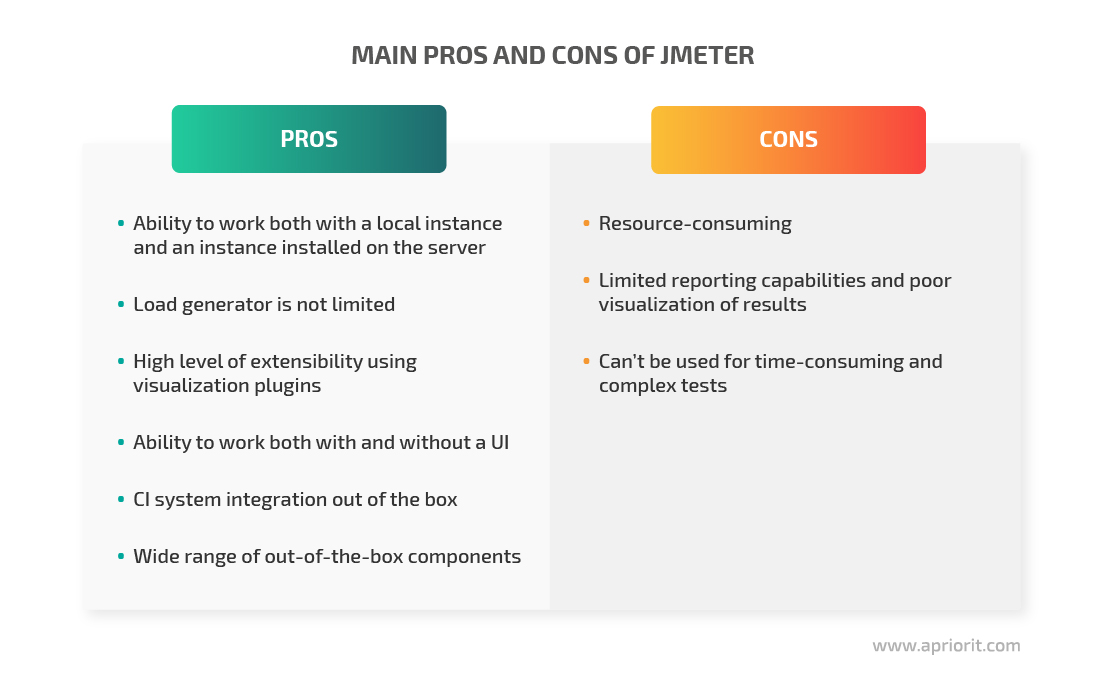
JMeter
JMeter is a load testing tool developed by the Apache Software Foundation. Originally developed as a web application testing tool, it’s now also capable of performing load tests.
Using JMeter, you can collect all kinds of metrics mentioned earlier (in combination with the PerfMon plugin or Telegraf). The major drawback of JMeter is the limited reporting functionality.
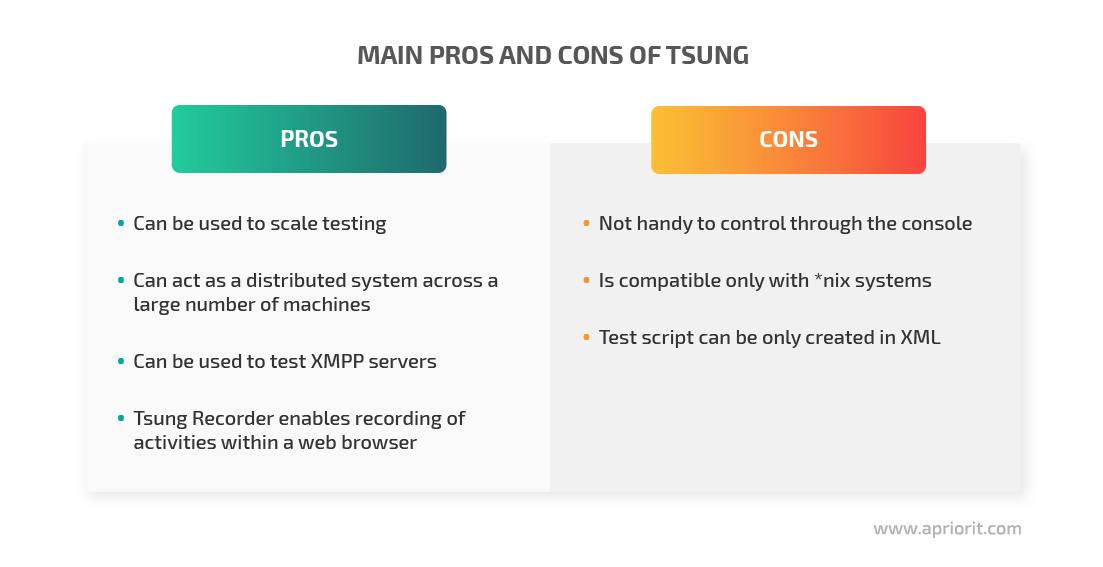
Tsung
Tsung is a distributed load testing system developed in Erlang. It has various useful features: support for different protocols and testing phases; monitoring of tested servers; tools to generate statistics and graphs from work logs.
At Apriorit, we use Tsung to test server performance. With this tool, you can collect the following server metrics in conjunction with the PerMoon plugin:
- LogicalDisk(_Total)% Disk Time
- LogicalDisk(_Total)Avg.Disk Bytes/Transfer
- LogicalDisk(_Total)Current Disk Queue Length
- Memory% Committed Bytes In Use
- MemoryAvailable Bytes
- MemoryCommitted Bytes
- Processor(_Total)% Idle Time
- Processor(_Total)% Interrupt Time
- Processor(_Total)% Privileged Time
- Processor(_Total)% User Time
- Processor Information(_Total)% Processor Time
- Web Service(_Total)Anonymous Users/sec
- Web Service(_Total)Connection Attempts/sec
- Web Service CacheFile Cache Hits %
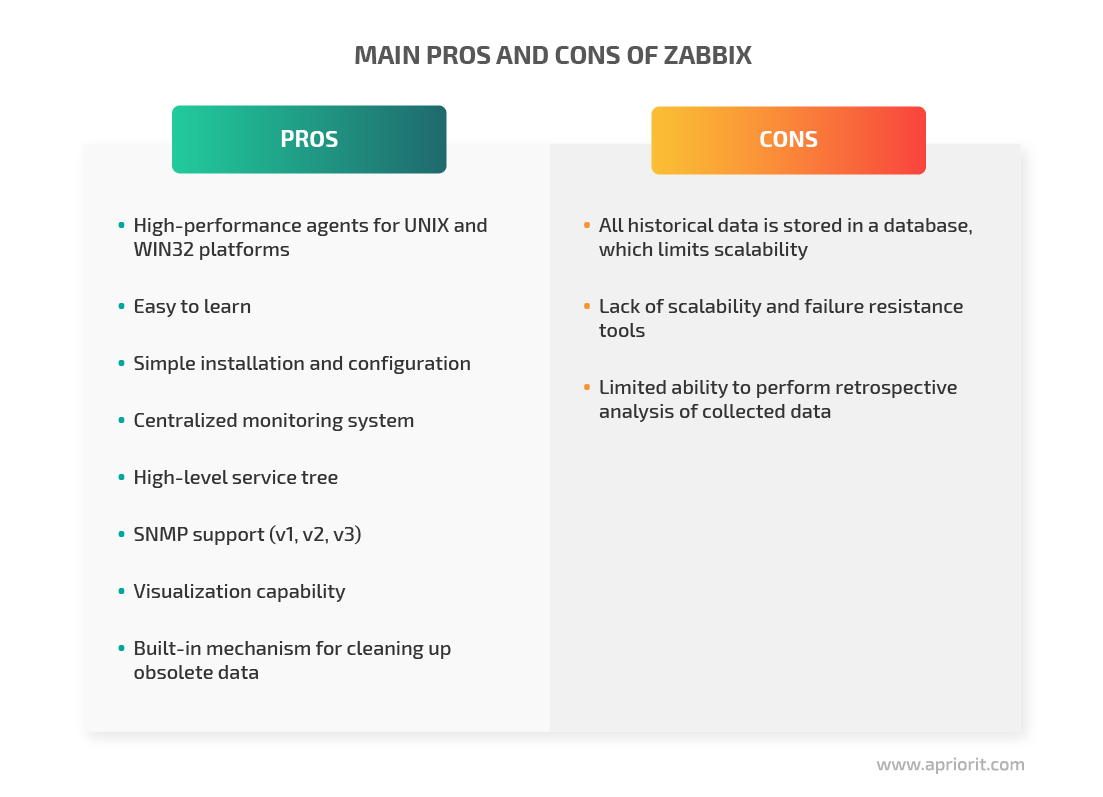
Zabbix
Zabbix is a system with a web interface that allows you to collect various data from devices. You can use it to monitor networks, virtual machines, databases, applications as well as the stability and integrity of servers.
Zabbix uses a flexible alerting mechanism that allows users to configure e-mail based notifications for almost any event. This allows for a quick response to server issues. Zabbix offers excellent reporting and visualization features based on historical data, making it ideal for capacity planning. Using Zabbix, you can check:
- Load per second
- Response time
- Response code
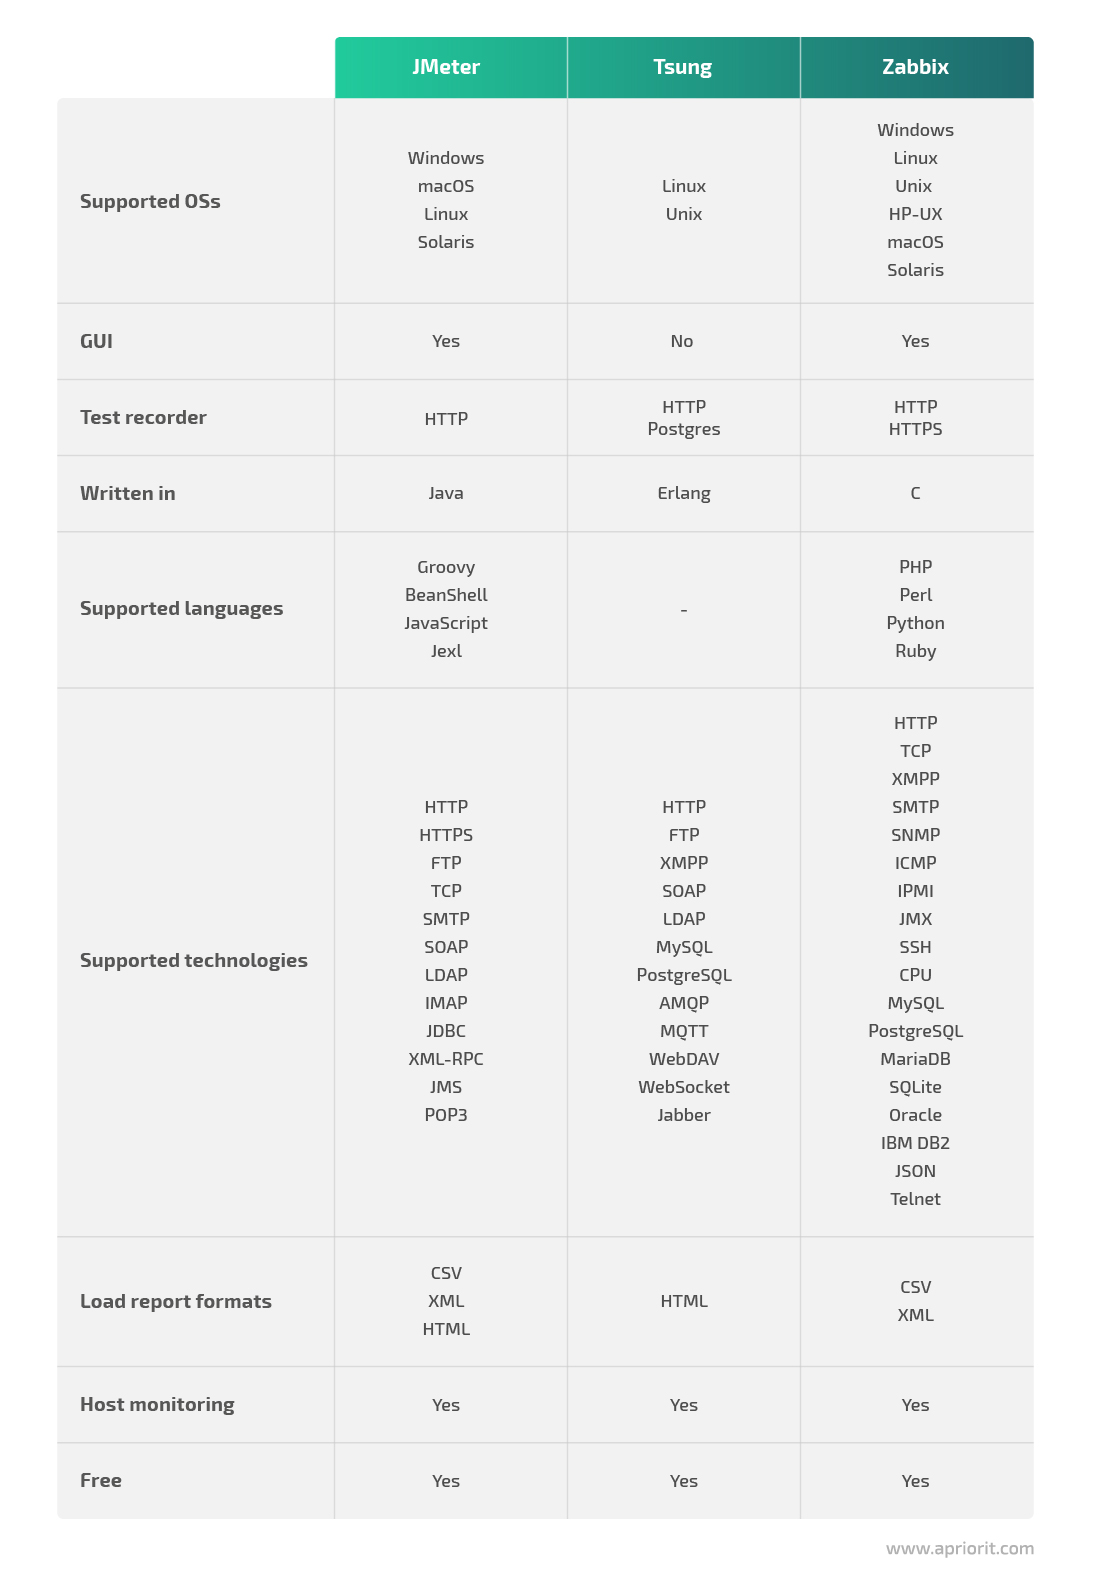
In the table below, we have gathered some important technical characteristics of each performance testing tool we use at Apriorit:
Conclusion
Stable performance is critical to an application’s positive reputation and market relevance. Performance testing in software testing helps ensure this stability. In this article, we described various types of performance testing, stages of performance testing, software testing metrics, and tools you can use to check the quality of your product.
If you need help implementing performance testing in your company, don’t hesitate to contact us. Our professional QA team is ready to help you measure the performance of your product at any stage of development.


