 Skip to main content
If you prepared the testing reports without making the preliminary analysis of the findings before, please start doing it. The correctly prepared report on the results of testing is a powerful tool for the optimization of the software development process. That is why let’s pay special attention to this process.
This article includes practical recommendations concerning the preparation of different types of testing reports and their ready examples.
Contents:
What is the notion of report on the testing results?
The Testing Report is a document, which contains the following information:
- The evaluation data about the state of the tested object,
- Information about the performed tests,
- Recommendations as for the further actions concerning the tested object.
The goal of the tester is not only to perform testing. It also consists in the correct design of the findings for their further use by developers and other specialists, who take part in the development of the tested functionality or project. That is why the Testing Report is a very important document.
Thus we can say that the Testing Report is the main source for the conclusion as for the compliance of the tested functionality or of the whole project with the requirements.
The outline of the report writing
The testing report, as well as any other document, has its own structure. The easiest and the most comfortable for the perception structure consists of three parts:
- The heading part;
- The final information about the testing results;
- The detailed results of passing the test cases.
Let’s have a deep look on the contents of every part of the testing report.
The contents of the heading part of the report include the following:
- The name of the project or the tested system
e.g.: Program1 – 2009.10.29
- The version number and the reference to the location of the tested version of the project or system
e.g.: Version location:comp1Program1Testing2009-10-29
- The name of the tested module (functionality) or the group of modules
- Configuration of the tested stand where the testing is performed
e.g.: Feature1 – Win XpSp3 x86, Win7 x 64…
Feature2 – Win Vista Sp2 x86, Win Server 2003 x86…
The contents of the second part of the report (the final information about the testing results) include the following:
- The name of the performed type of testing
e.g.: Acceptance testing
Feature1 (Smoke testing)…
- The current state of the task:
- Testing is completed
- Testing is not completed
- Brief description of the found critical bugs
- The quality level of the tested version and the common statistics of passed test cases:
Quality Level – the quality level of the tested version;
Total – the total amount of completed test cases;
Passed – the amount of successfully completed test cases;
Failed – the amount of failed test cases;
No Run – the amount of not completed test cases;
N/A – the number of test cases that are not available for passing at the moment.
The quality level is calculated by the following formula:
Quality Level =(Passed(Total-No Run))*100.
e.g.:
| Total = | 361 | % |
| Passed = | 310 | 85,9 |
| Failed = | 26 | 7,2 |
| No Run = | 25 | 6,9 |
| N/A = | 0 | 0 |
| Quality Level = | 92,3 % | |
It is useful to make graphs of the quality level changes from version to version for better understanding of the functionality or project quality state.
e.g.:
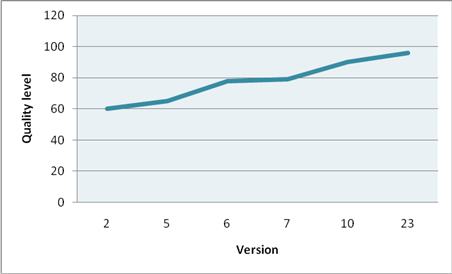
It is clear from the graph that the project quality state is rising in leaps and bounds with every version and will reach the point of 100 % soon.
- Recommendations as for the results of testing on the basis of Quality Level
The final part of the report consists of the detailed results of passing the test cases:
- The list of new tickets (New);
- The list of closed tickets (Closed);
- The list of tickets, which were returned for improvement (Feedback);
- The list of tickets, which describe the correct behavior, but not the bug (Not_a_bug);
- The list of dependent tickets, which await the check of other tickets;
- The list of tickets whose check is put off (waiting for the new version, customer’s reply or some other information, etc.)
- The list of newly opened tickets etc.
This part also contains recommendations as for the results of the check of tickets on the basis of quality product metrics in software testing.
Quality metrics:
| Description | |
| Closed/All Bugs | This metric shows the connection of the amount of closed bugs with the rest of them |
| Reopened/Closed Bugs | This metric shows the connection of the amount of reopened bugs with the closed ones (fixed and rechecked) |
| Not_a_bug/New Bugs | This metric shows the connection of the amount of rejected bugs to the opened ones |
| Bugs by Severity | The amount of bugs by severity |
| Bugs by Priority | The amount of bugs by priority |
Such metrics as “Closed/All Bugs” (if the data coefficient is close to “1”, we can say about the improvement of the product state), “Bugs by Severity”, and “Bugs by Priority” point to the level of product approximation to the achievement of quality criteria by bugs and its dynamics.
Such metrics as “Reopened/Closed Bugs” and “Not_a_bug/New Bugs” aim at tracking the work of separate participants of developing and testing groups. The “Reopened/Closed Bugs” metric lets you to evaluate the work of developers: to see how often they admit the appearance of bugs that were fixed earlier; the “Not_a_bug/New Bugs” metric aims at evaluating the work of testers: to see how often they make mistakes in bug description.
Of course, these metrics should be applied depending on the specific character of the product. The metrics of quality carry useful information about the state of the project in case you track them during the process of testing and compare the received results with the results of testing of previous versions.
Types of testing reports
One of the main report rules is that it must not include the unnecessary and repeated information. But before you begin to draw the report it is necessary to make an analysis of the performed actions. Information in the report can change depending on what was tested.
Let’s examine the types of reports depending on the type of the accomplished work:
- Report on the regressive testing of separate functionality/module of the project;
- Report on testing of the implemented functionality/module of the project;
- Report on performance of the prerelease/full testing of the project version;
- Report on the check of tickets (for the evaluation of the state of the project version by means of fixed tickets).
The enumerated above structure of the report is almost suitable for the case of prerelease testing of the whole version and also for testing just implemented feature. It is so because during the prerelease testing tickets are usually checked and the acceptance testing is performed. Also if the new feature is being implemented, especially a big one, it is akin to the whole project.
If the regressive testing of a separate functionality/module of the project is performed, the usual statistics will be enough.
We do not include the statistics of passing the test cases while writing the report on the check of tickets because we do not pass them. And with the help of metrics of quality we can evaluate the progress of the project as a result of fixing the bugs for the better or for the worse, as well as the work of developers and testers.
For whom do we write reports?
The contents of the report can also change depending on the target reader:
- manager;
- developer;
- other tester or test manager – and what information each of them expects to receive from the report.
It means that having defined the type of the goal, which will be described in the report, we must ask ourselves the following questions at first:
- Whom is this report intended for?
- Why do we send it?
- What can be done on the basis of this report?
1) The Project Manager needs to know the following:
- the state of the project at the moment;
- the list of critical bugs, which were found, fixed, or rereproduced;
- recommendations as for the further actions;
- the description of the configuration of the test stand where the testing was performed;
- Quality Level + metrics of quality.
2) The Developer needs to know the following:
- The version of the project where the testing was performed;
- Bugs, which were found, fixed, or rereproduced;
- Recommendations as for the further actions;
- Quality Level + metrics of quality.
3) Other tester and test manager need to know the following:
- The name of the tested project (on the results of testing of what project this report is);
- Brief description of the current state of the project;
- The description of the configuration of the test stand where the testing was performed;
- The common statistics of the completed tests.
As we can see, the necessary information for each of the specialists differs a little. It depends on what each of the specialists will undertake on the basis of the received report and what information is more valuable for him.
The example of the testing report
Let’s have a look at the example of the report on the results of the prerelease testing.
Program1 – 23.03.2010
Version location:
1. Feature1 testing (smoke testing)
Task status: testing is completed
Result: Feature1 is ok: QL = 98 %, one not critical bug was found.
Configuration:
Component1: Win7 x86, 23-03-2010
Component2: XpSp3 x86, 21-03-2010
Component3: VistaSp2 x86, 23-03-2010
Component4: Win7 x64 – 22.03.2010
| Total | 51 | % |
| Passed | 50 | 98 |
| Failed | 1 | 2 |
| No run | 0 | 0 |
| na | 0 | 0 |
New:
[Ticket #1] [Feature1]: Tiket1_name
2. Acceptance testing
Task status: testing is completed
Result: ok, critical or blocked bugs were not found
3. Tickets checking
New:
[Ticket #2] [Feature2]: Tiket2_name
[Ticket #3] [Feature3]: Tiket3_name…
Closed:
[Ticket #4] [Feature2]: Tiket4_name
[Ticket #5] [Feature1]: Tiket5_name…
Feedback: …
Metrics:
Closed/All Bugs = x
Bugs by Severity = x
Bugs by Priority = x
Reopened/Closed Bugs = x
Not_a_bug/New Bugs = x
Recommendations: the version is ready for release.
To learn more on how to improve manual testing process, check out our article on 6 ways to improve software testing.
Conclusion
Let’s sum up.
It is not enough to know the common structure (pattern) of the testing report design to write it effectively. The report will not be effective without the preliminary analysis. What does the analysis of testing results include? It includes the following:
And let your product be of high quality!
Learn more software testing tips in our blog – Test Estimation Techniques
Get details on the Apriorit’s software QA skills and projects
Have a question?
Ask our expert!
VP of Engineering


