 Skip to main content

Apache JMeter is one of the most commonly used tools for performance testing of multi-user applications. But despite JMeter’s many guides and robust documentation, some aspects of working with JMeter remain obscure. In this tutorial for performance testing using JMeter, we share our experience configuring and using JMeter for testing web application performance.
This article will be useful for QA engineers and team leaders who want to know more about optimizing performance testing processes in their projects when working with Apache JMeter.
Contents:
What is JMeter and how to use it
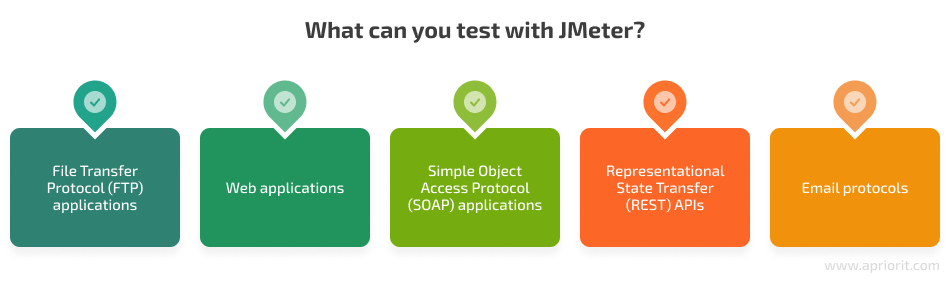
Apache JMeter is a free open-source tool used to analyze and measure the performance of applications, software services, and websites. You can also use JMeter to test the functionality of server protocols under various loads. Apache JMeter simulates large server loads by creating multiple virtual users.
At Apriorit, we mainly use JMeter for performance testing. But we don’t miss the opportunity to make life easier for our QA specialists by using JMeter in other cases:
- To create test scenarios and combine them into a test plan, which allows us to detect and fix various performance issues including memory leaks, application scalability problems, and security issues during peak loads
- To generate test data, which simplifies and speeds up the creation of test plans
For example, in one of our projects we needed to check how a page was displayed and processed interactions with users in potential future situations with more than 1,000 users. In this case, we did the following:
- First, we created one request to create users through JMeter and generated a list of unique user data in CSV format.
- Next, we added the CSV file to JMeter and ran our test in multiple streams. As a result of using multiple streams, the task took only several hours instead of several days.
- The QA specialist was able to work on other tasks instead of doing repetitive manual testing.
If this task were assigned to only one QA specialist, it would take a lot of time and resources to complete it. We used JMeter to avoid wasting our QA experts’ time and complete the task much faster.
Next, we take a look at the hardware requirements for Apache JMeter for performance testing and the steps to install and configure this tool.
Ready to level up your web app performance?
Make sure your solution works as expected by entrusting Apriorit’s quality assurance experts with performance testing and other essential QA activities.
Preparing to work with JMeter
Apache JMeter’s documentation provides information on how to configure and use this tool. However, the documentation does not describe hardware requirements. That’s why we’ll talk about the hardware requirements and steps of setting up JMeter for Windows.
1. Preparing the infrastructure
Based on our experience, we’ve outlined some core hardware and software requirements for performance testing using JMeter:
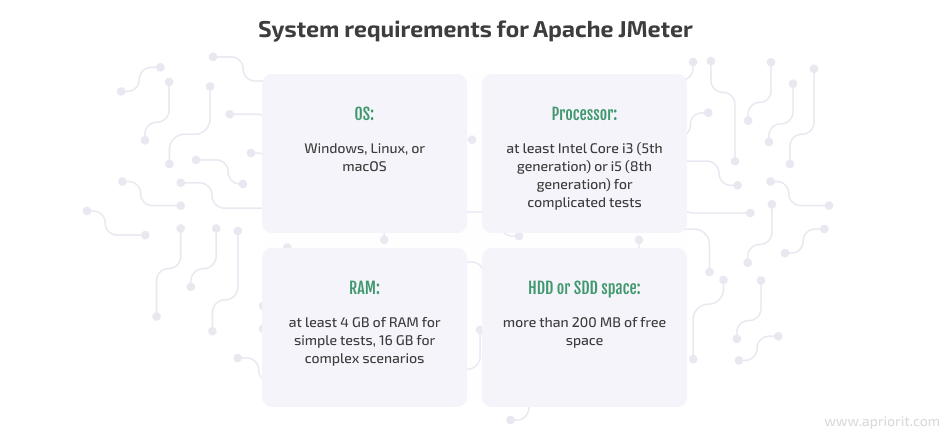
Since JMeter only does performance testing in Java, you need to install the Java Development Kit (JDK) version 8 or higher to work with it. You can use the Oracle Java Runtime Environment, but it’s best to install the JDK because you need the keytool utility from the JDK to write JMeter HTTPS.
Let’s take a closer look at installing the JDK on Windows 10:
- Go to the official JDK website.
- Select your version of Windows and click the link to the relevant installation file to start downloading it. The download should start automatically.
- After the download is complete, run the setup file and follow the instructions in the installer.
- When finished installing, restart your PC.
- Add environment variables if they did not appear on their own after rebooting. To do this, open: Start → Control Panel → System → Advanced Settings → Advanced (tab) → Environment Variables.
- Fill out the System variables section (see below).
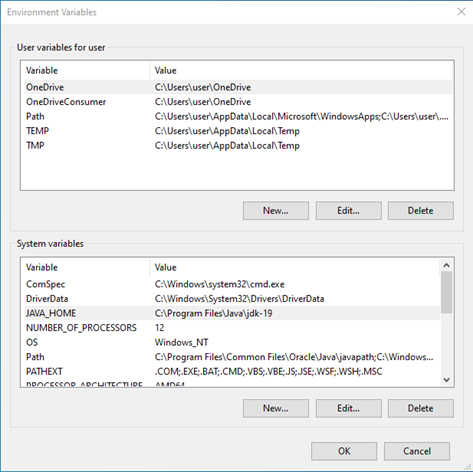
In the System variables menu, click New… and enter JAVA_HOME as the variable name. Then specify the path to the JDK in the variable value field. For example: C:\Program Files\Java\jdk-17.0.2. Finally, add the %JAVA_HOME%bin string to the value of the Path environment variable.
2. Installing JMeter
After preparing the environment, you can install JMeter itself:
- Go to the official Apache JMeter website.
- Go to the Download section and open Download Releases.
- In the Binaries block, download the JMeter.zip file.
- Unzip the downloaded archive to any location on your system.
- Go to the bin folder within the extracted folder and open the jmeter.bat file. This will start the installation.
Read also
A Comprehensive Guide To Performance Testing: Stages, Metrics, and Tools
Explore how you can leverage efficient performance testing for your project. Apriorit’s experts prepared a comprehensive guide, offering practical advice on conducting performance testing and choosing suitable tools for it.

3. Understanding basic elements of the test plan
A test plan in JMeter is a sequence of steps executed during the test run. You can think of a test plan as a container for running tests. It determines what will be tested as well as where and how tests will be run. Any test plan should contain lists of requests to the resource under test, which in turn are combined into thread groups. Also, test plans can contain logical controllers, configuration elements, listeners for displaying results, etc.
Typically, each test plan has several interlinked parts that are formed based on the load profile. The load profile reflects the percentage of operations performed by different types of users. For example, say that a system has user and admin roles. We know that there are more users than admins in the system, and users are more active than admins. As a result, the load profile may state that 20% of the load is generated by admins and 80% by users.
In JMeter, a minimal test plan consists of three types of elements:
- Thread group
- Samplers
- Listeners
Next, we look at the most commonly used elements of a test plan.
Thread group
A thread group is the main element that is included in the test plan. In a thread group, you can write scripts, add custom logic, and include test controls. The elements of this group, such as samplers and controllers, are the starting points of any test plan in JMeter, and therefore they must be located inside it.
For example, let’s say that the site under test has different groups of users with different roles and different levels of access. You plan to include all user groups in the test. In this case, you need to sort all requests by user groups or roles and put them in separate thread groups.
In JMeter, the thread group element responsible for configuring application loads is located in the Threads (Users) category. The main parameters of the thread group element are specified in thread properties, which are discussed in detail below.
Thread properties
This panel allows you to configure the load by emulating the application. Here are some of the configurations you can find:
- Number of threads – the number of emulated users who work with the application at the same time
- Ramp-up period – the time interval between launching threads; for example, if you specify Number of threads = 10 and Ramp-up period = 100, this will mean that every 10 seconds a new thread will be launched
- Loop count – the number of cycles during which the plan will be executed within the thread group; an infinite loop count means that the plan will continuously be executed until it is explicitly interrupted
Let’s imagine you have a simple test in which the user accesses the site, logs in to the system, and logs out. To test the website’s performance, you need 50 similar users to log in to the test site within one minute. In addition, you want each of these users to repeat this action three times. To achieve this goal, you will need the following settings in thread properties:
- Number of threads – 50
- Ramp-up period – 60
- Loop count – 3
Configuration elements
Configuration elements allow you to set global settings and variables for the entire test plan. The data from these variables will be used by samplers later. You can use configuration element settings both for the entire test plan, defining them at the beginning of the test plan, and for specific parts of the plan, placing it inside a specific controller or sampler.
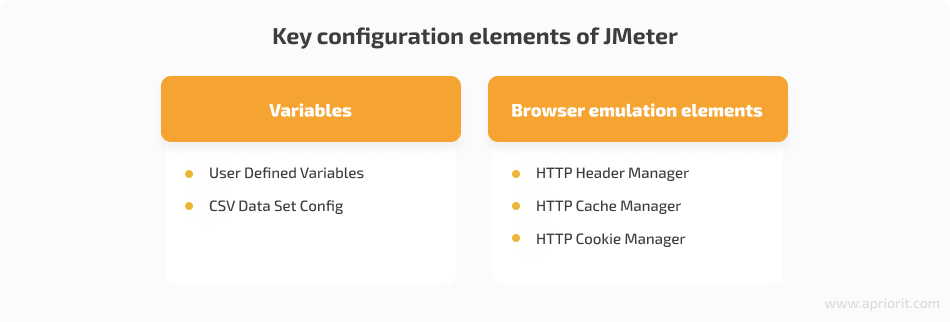
User Defined Variables. This element allows you to specify a set of global variables that will be used in the test plan, as well as their default values. This can be useful when you need to use certain variables frequently throughout the test but might need to change a variable quickly. Such variables can be site data, logins, passwords, tokens, etc.
For example, say you need to launch performance testing of a web application using JMeter in different environments with the same data set. In order not to create tests for each environment, you can mark the data that you’ll use for testing the site as variables in User Defined Variables. These variables can be assigned to any field of any element of the test plan. A reference to a variable in a test element is specified in the format ${variable name}.
Here is another example. In order to define the parameters of the https://localhost:9090 address with the help of the User Defined variables, you must enter the following value in the corresponding field: http://${server}:${port}. This implementation will allow you to run the test in a different environment just by changing the value of the parameter in User Defined Variables.
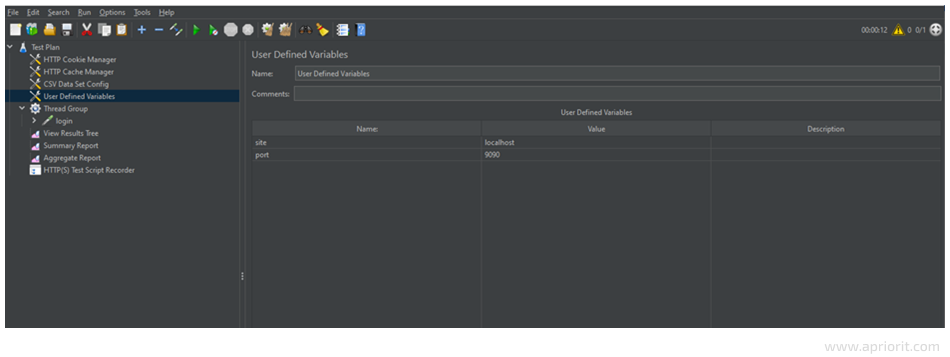
For simplicity and clarity, we recommend placing the User Defined Variables element at the beginning of the test plan.
User Defined Variables panel:
- Name – name of the variable to refer to in the test
- Value – value of the variable
- Description – description of the variable (for informational purposes)
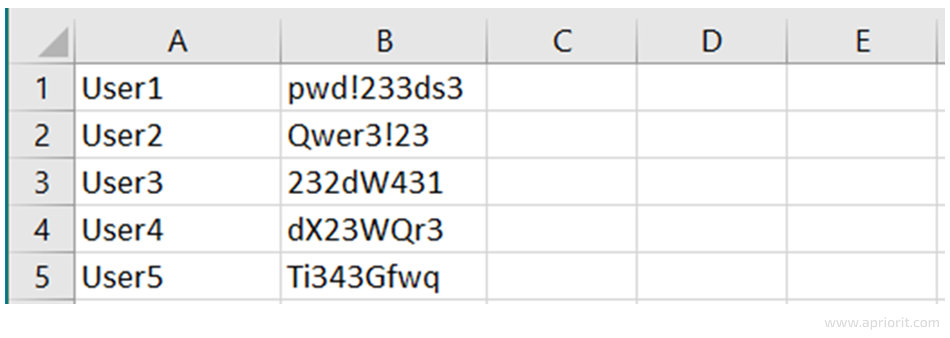
CSV Data Set Config. This element reads data from a text or CSV file. For example, if you want to test your website under the load of 100 unique users, you can create a CSV file that contains 100 user records and credentials in a column. Implementation details will be presented in the next section. This way, you’ll be able to declare data from this file in queries and samples and as specific local JMeter variables throughout the test for each thread.
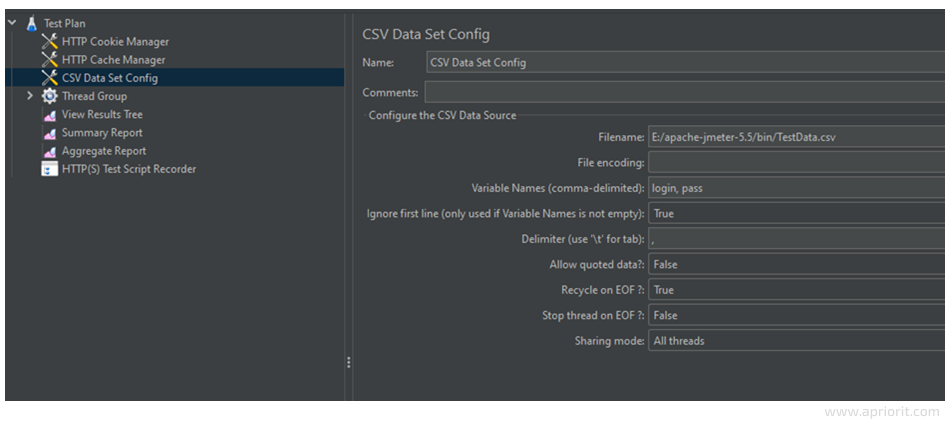
Let’s consider how to fill in the main parameters of the CSV Data Set Config element:
- FileName – Specify the path to a text file or CSV file that stores user data.
- Variable Names – Specify variable names for values separated by commas in the same sequence as the corresponding columns in the text or CSV file. Later, you can declare them in samplers as
$login,$password, and$Id. - Delimiter Specify the delimiter used in your CSV or text file to logically separate user credentials.
- Allow quoted data – Allows the value to contain a delimiter.
- Recycle on EOF – This parameter is true by default. JMeter should restart from the beginning when the End Of File (EOF) is reached.
- Stop Thread on EOF – This parameter stops the current thread that collects the value if EOF is reached.
- Sharing mode – Set configuration element data to be used between all threads or only within a specific thread or thread group.
Here is a sample CSV file that contains user credentials:
HTTP Header Manager – Allows you to add or override headers for requests sent to JMeter. Records added to a request are viewed as a list of data for the sampler. When you send a request to the web server, headers contain the following information:
- Browser in use
- Encoding
- Preferred language of the received page
- Requests redirection
- Etc.
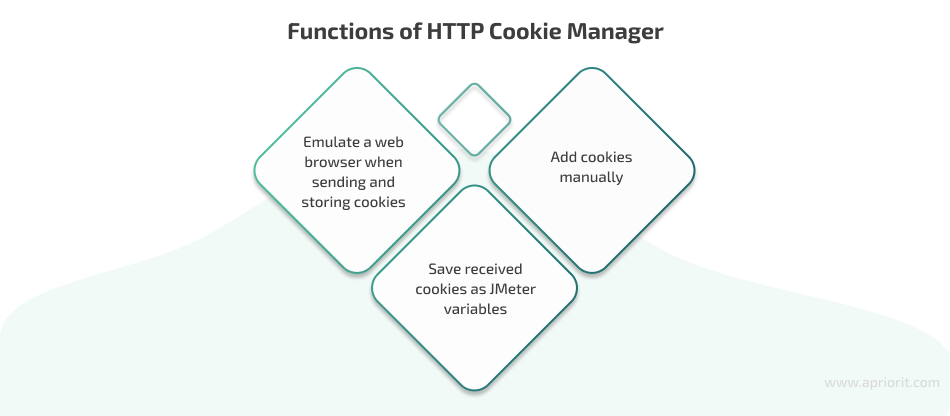
HTTP Cookie Manager – Almost all websites use cookies to store information about login sessions. In JMeter, HTTP Cookie Manager processes the cookie data collected during a test run. So when you are testing a web application, you need to add the HTTP Cookie Manager to your Thread Groups in JMeter to be able to process cookies in the same way as browsers do. The HTTP Cookie Manager element has three functions:
HTTP Cache Manager – There are several mechanisms in web browsers that can reduce incoming internet traffic. One such mechanism is resource caching for resources downloaded from the network. After initial caching, all subsequent requests can be fulfilled without loading the web server. HTTP Cache Manager should be used when testing websites to make JMeter work more like a web browser.
Samplers
HTTP Request Sampler – Sends HTTP and HTTPS requests to a web server. The main elements of an HTTP request include:
- Web Server – defines the type of protocol as well as the domain name or IP address of the web server and the server port
- HTTP Request – specifies the request method and the path to the requested resource
- Send Parameters with the Request – defines parameters to be sent in the request; when you use automatic script recording tools, the queries you add already have the necessary parameters if the request type itself calls for passing them
Listeners
Listeners help you view and analyze information collected by JMeter during the test in tabular or graphical form. They also collect and group various performance metrics useful for discovering bottlenecks in system performance. Listeners in JMeter are located in the listeners category. They are typically added as a nested element of the thread group in order to analyze the data of samplers executed in the particular thread group during the test.
Some of the most sought-after listeners are:
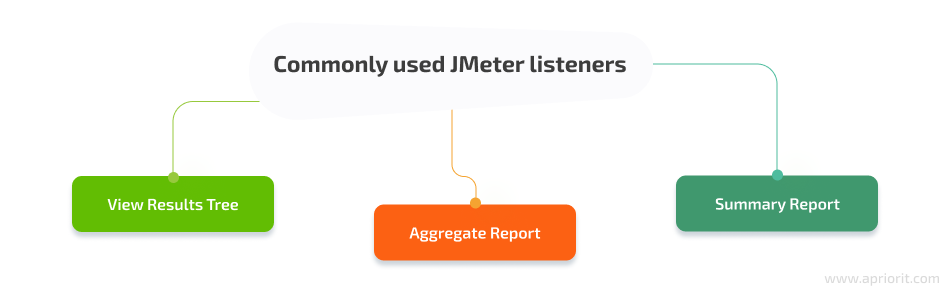
The View Results Tree listener displays the results of samplers and their associated assertions in a tree structure. These results are displayed in the same order in which they were initialized in the test. The View Results Tree listener also displays the parameters and data for each of them.
For example, for each request sent using the HTTP Sampler element, the View Results Tree listener returns an object that contains the parameters of the request sent as well as the response received from the web server.
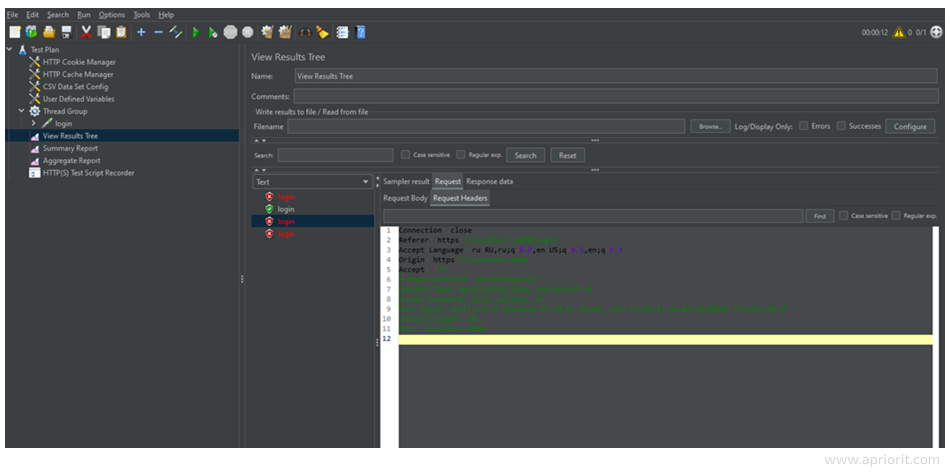
This data is displayed in the corresponding tabs:
- Sampler result
- Request
- Response data
Aggregate Report is a summary table with execution rates for each unique sampler in the test plan. One of the main metrics of this report that distinguishes it from other reports of this type is percentiles. Percentiles represent the time in which a corresponding proportion of requests receive a response. You can check the indicators for the Aggregate Report summary in the official documentation. The main settings of Aggregate Report include:
- Write results to file/Read from file – specify the name of the file to write these reports to after passing the test
- Log/Display only – specify any parameter according to which information will be written to the table
- Configure – specify the composition of data displayed in the file
The Summary Report is a summary table showing the statistical performance of each unique sampler in the test plan. You can check the indicators for the Summary Report in the official documentation as well.
After creating and setting up all test configurations, some requests can be omitted. The next step is to start debugging your test plan so your test contains only requests necessary for testing.
Now that you are finished with installing and setting up JMeter, let’s take a closer look at how to use JMeter for performance testing.
Related project
Developing a Custom ICAP Server for Traffic Filtering and Analysis
Discover the details of creating a unique custom ICAP server with extended functionality. Read on to explore more details of how Apriorit developers and QA specialists helped our client attract new customers and increase revenue.
Testing web application performance with JMeter
You can work with JMeter in graphical user interface (GUI) mode or command-line interface (CLI) mode, which is also called non-GUI mode. The GUI mode is used to create and debug test plans, while the CLI mode is for running tests. It’s best not to conduct testing in GUI mode, since JMeter consumes significantly more system resources in this mode than in the non-GUI mode. This can lead to false negatives in tests.
To start the JMeter GUI mode, use the scripts in the jmeter/bin directory:
- jmeter.bat – for Windows
- jmeter.sh – for Linux
When the main application window pops up, JMeter is ready for use. After that, you can start writing your own test plan.
The use of JMeter for performance testing can be split into four steps:
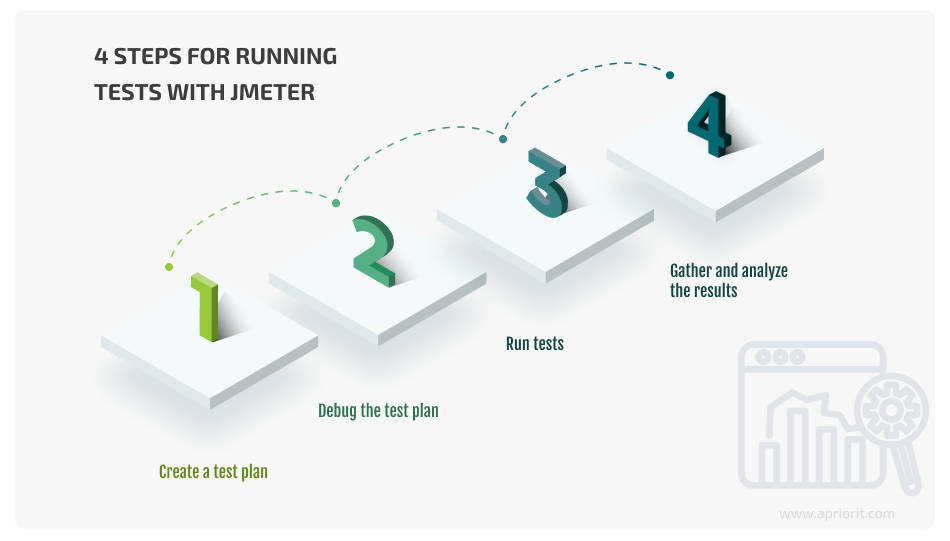
Let’s take a look at these steps in detail.
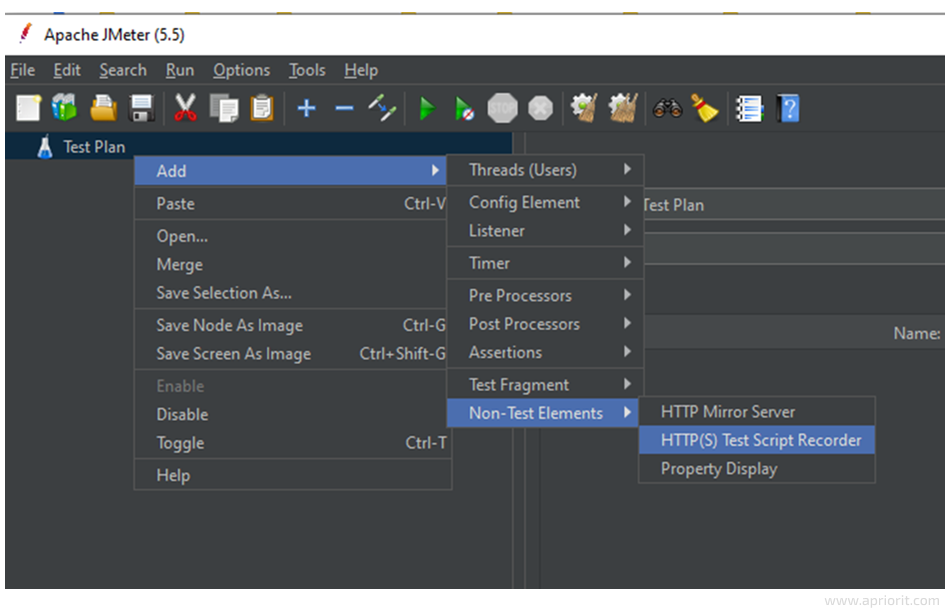
1. Create a test plan
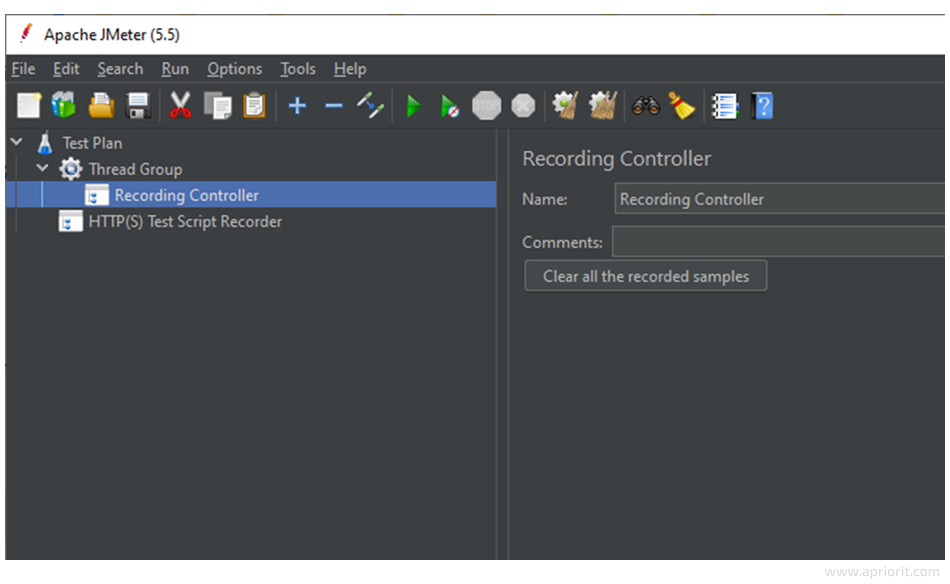
You can create a test plan by manually adding the necessary requests and query parameters. However, if the test plan should contain many requests, we recommend using HTTP(S) Test Script Recorder to speed up the process and reduce the risk of human errors.
Let’s take a look at the basic settings for HTTP(S) Test Script Recorder:
- Port
- Target Controller
If the Use Recording Controller value is used in the Target Controller field, all requests passing through the proxy will be recorded in the first Record Controller of our test plan. Also, at the time the proxy is launched, this controller should already be in the test plan. Instead of the Recording Controller, you can use HTTP(S) Test Script Recorder or add a Thread Group to the Test Plan.
In addition to the general settings, you can filter requests by components or elements in HTTP(S) Test Script Recorder.
Static components and elements include:
- Images (PNG, JPG, JPEG, etc.)
- Cascading Style Sheets (CSS)
- JavaScript files (JS)
- Interchange Format (GIF, JIF, etc.)
- favicon.ico
- Adobe Flash files (SWF)
- Font formats (WOFF, WOFF2, etc.)
Note: Some of these components or elements are not important for the load, as they are static and stored in the browser cache. Their purpose is to reduce network traffic and increase the speed of page loading.
You can set request filtering in the Requests Filtering tab by using the URL Patterns To Exclude setting, specifying the requests you want to filter out in the form of regular expressions.
Apriorit QA specialists often use the following regular expression to exclude static components and elements when running performance testing:
(?i).*\. (bmp|css|js|gif|ico|jpe?g|png|swf|woff|woff2|txt).*Where:
.* is any character
\. is the corresponding .(dot) symbol
css is the format of the extracted elements
| is a separator between excluded element formats
To start recording browser requests, click the Start button in HTTP(S) Test Script Recorder. After that, a dialog box will appear asking you to install the root certificate of the root certification authority (CA) to be able to listen for HTTP/HTTPS traffic. JMeter creates this certificate, called ApacheJMeterTemporaryRootCA.crt *, after you click the Start button in the bin folder.
The certificate is valid for seven days. If the tested site works via the HTTP protocol, it is not necessary to use a certificate.
You can find a detailed description of the certificate installation process for different browsers in the JMeter documentation.
After installing the certificate, you need to change the browser settings to use JMeter Proxy. Using a proxy is necessary for channeling browser traffic through the Test Script Recorder. Here’s how you can do it:
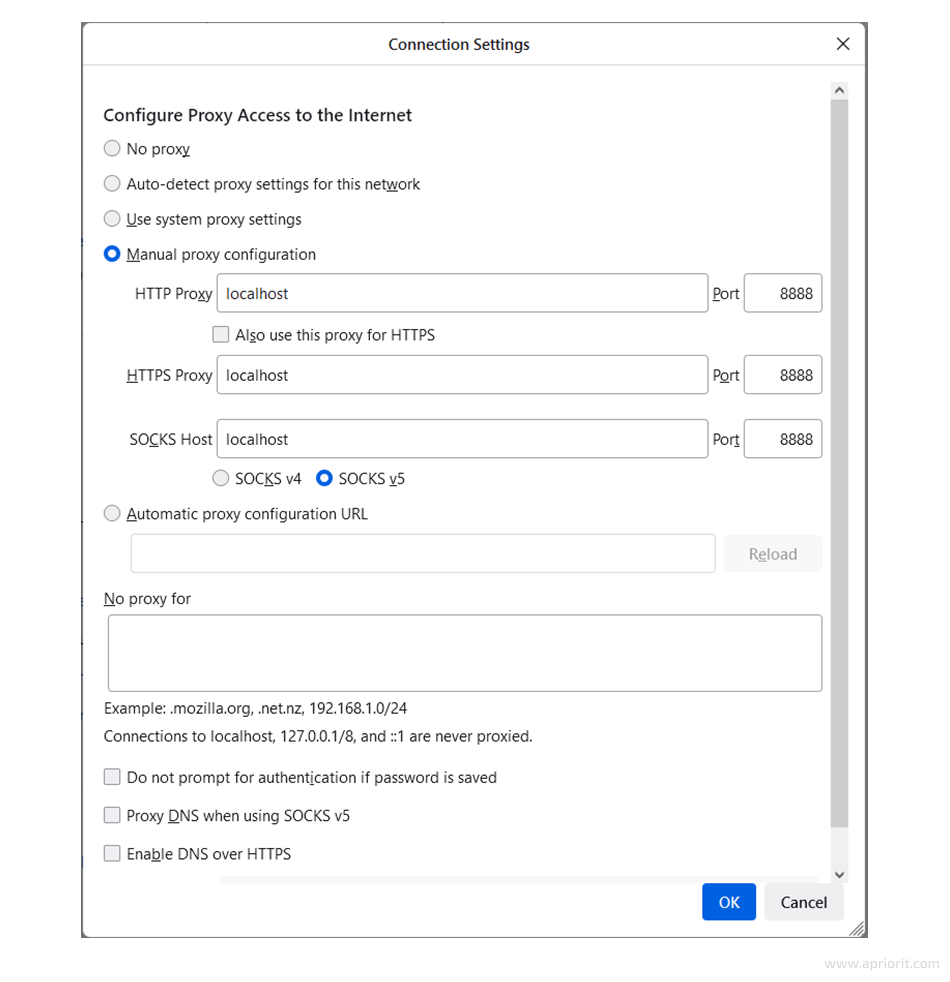
- Launch your browser without closing JMeter.
- Open your browser’s main menu and go to Settings.
- In your chosen browser settings, go to Network > Connection.
- Select Manual proxy configuration. In the HTTP proxy field, type “localhost” and set the port specified in the HTTP(s) Test Script Recorder setting (the default port is 8888).
- Click OK.
After that, with the active HTTP(s) Test Script Recorder, your actions in the browser will be recorded and displayed in JMeter in the selected controller. To record the test plan, you need to manually perform in the browser the actions that should be in the test plan.
2. Debug the test plan
Once the requests necessary for testing have been recorded via HTTP(S) Test Script Recorder, you can start debugging the test plan. First of all, you need to review the recorded requests and remove unnecessary ones, such as requests to third-party resources or from installed browser extensions. They aren’t needed in the test for several reasons:
- These requests will not provide you with information about the performance of the tested resource.
- Test execution reports will contain skewed results because the average indicators will include unnecessary requests.
- Unnecessary requests will consume additional hardware resources, which in turn can distort the test results.
After removing unnecessary requests, you can distribute the remaining requests among thread groups. If necessary, you can add User Defined Variables or CSV Data Set Config to the test, as well as HTTP Cache Manager and HTTP Cookie Manager. To view and analyze the results of test execution, add the listeners to the test plan. We described how these elements work in the Basic elements of the test plan section.
After setting up the test plan and adding the necessary elements, save the test plan on your device. The path to the test plan should not contain spaces. Next, let’s talk about the specifics of running your test.
Read also
Using Web Debugging Proxies for Application Testing
Find out how traffic monitoring can help your team fine-tune your application, discover performance and security issues, and enable or restrict some features. Read on to explore practical examples of monitoring HTTPS traffic using Fiddler and Charles proxies.
3. Run Tests
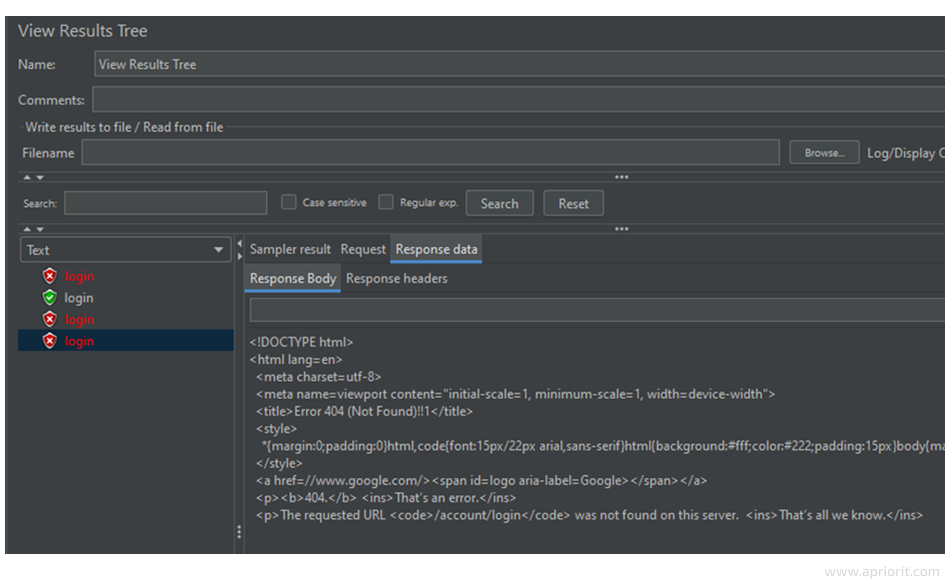
After debugging, run the test with a small number of users, preferably from five to ten, to make sure that the plan works correctly. Check the server responses in the View Results Tree to ensure that the plan works as intended. Responses from the server should not contain errors in the 400s and 500s. Successful requests are highlighted green, and failed ones are highlighted red.
Further testing with a large number of users should be carried out only in non-GUI mode. To run JMeter in non-GUI mode, do the following:
- Remove all graphic listeners from the test plan, since they will not work in non-GUI mode.
- Enter the following command in the command line:
jmeter -n -t C:\ my_test.jmx -l report/log.jtl -e -o report/report.jtl
There are several parameters in this command:
nstarts the non-GUI mode.tis the path to your test plan in JMX format.lis the place where the JTL file with the results of the test script will be created.eis the parameter at which the report panel is generated after completing the test.ois the folder where the reports panel will be saved.
If there are no additional errors, JMeter should finish running the tests and generate a report. In the next section, we take a closer look at analyzing data in this report.
4. Gather and analyze the results
After completing the test in non-GUI mode, JMeter generates a report and saves it to the address specified with the -o parameter during the test. To view the report, open the index.html file using any browser.
This report will contain the following sections:
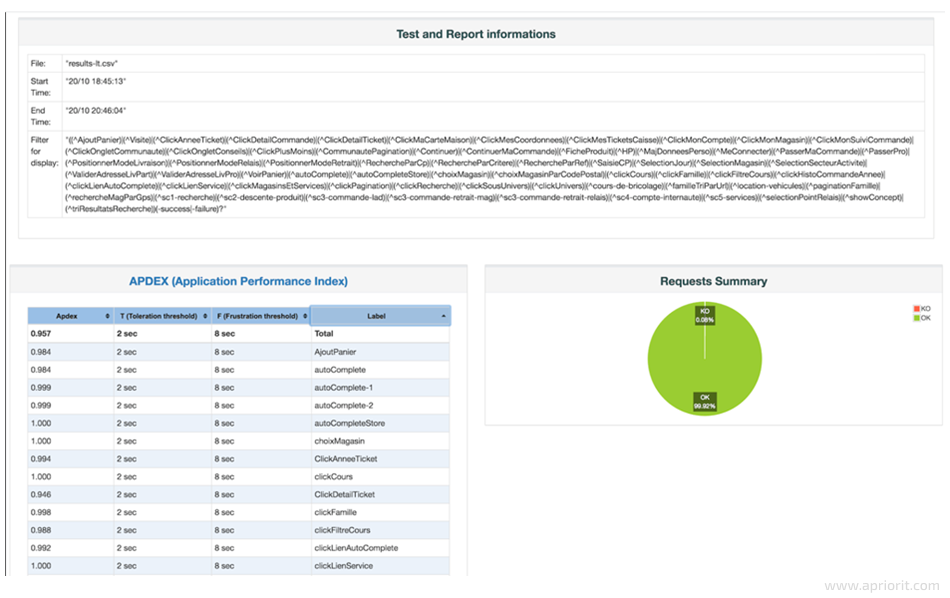
The main test results are located on the Dashboard tab and contain the following:
The Application Performance Index (APDEX) table computes the index for every transaction based on configurable values for tolerated and satisfied thresholds. The Request Summary Graph shows the percentage of successful and failed requests. It doesn’t take Transaction Controller Sample Results into account:
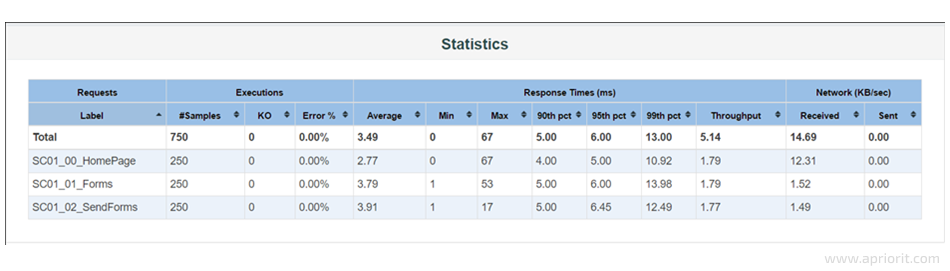
The Statistics table provides a summary of all metrics per transaction, including three configurable percentiles:
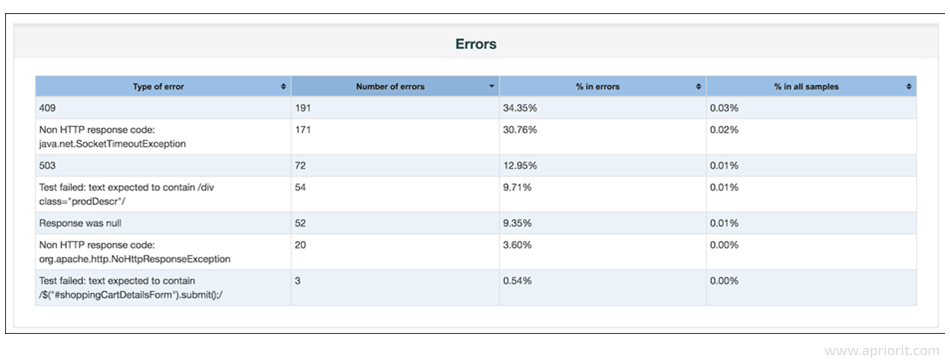
The Errors table provides a summary of all errors and their proportion in the total requests:
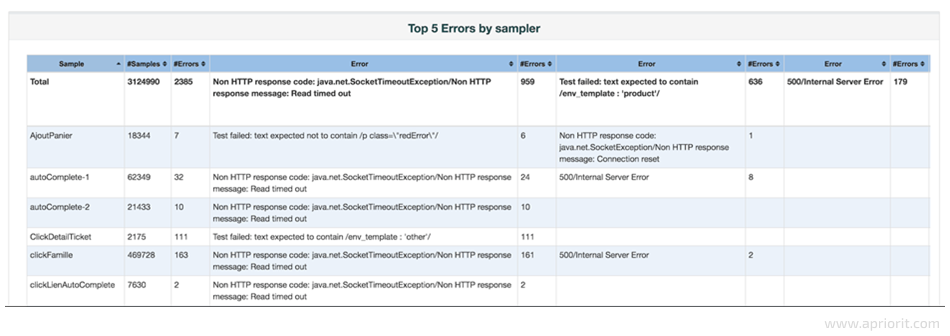
The Top 5 Errors by Sampler table provides key errors for every Sampler, excluding Transaction Controller by default:
The Charts section contains more detailed information about the workload, errors, etc.
The Custom Graphs section does not contain any information by default. Data in this section can be displayed when using custom listeners in the test plan.
In most cases, a standard report is enough to draw conclusions about the performance of the app during the initial performance assessment. It also allows you to detect bottlenecks and requests with the most errors.
However, with an integrated approach to web performance testing using JMeter, you need to analyze not only requests, errors, and response times, but also the load on the server in real time. In this way, you can identify bottlenecks in the application hardware.
Conclusion
Apache JMeter can be very effective in terms of performance testing, but there are many configurations that are easy to miss.
Web performance testing using JMeter can significantly increase the effectiveness of your QA processes. And in the hands of a proficient team of QA specialists, this tool can become a cost-efficient solution for time-consuming testing.
Apriorit professionals in quality assurance and security testing will gladly assist you with any project. We can conduct load testing and functional testing of your web applications with JMeter or other tools suitable for your project.
Need help enhancing your web application?
Delegate the quality assurance tasks to Apriorit’s QA professionals to assess your web app’s performance and receive practical advice for its improvement.
Have a question?
Ask our expert!
VP of Engineering


