 Skip to main content
Code coverage is one of the most common metrics that helps software developers and quality assurance (QA) specialists assess testing efficiency. Evaluating code coverage helps you determine testing completeness, identify unnecessary code, and detect bugs.
In this article, we briefly explore what code coverage is, list the most popular tools for measuring it, and show how to evaluate the percentage of code coverage using the open-source OpenCover tool. This article will be helpful for developers, testers, and QA specialists who want to learn how to use the OpenCover tool for code coverage measurement.
Contents:
What is code coverage?
Code coverage is a measure of the percentage of program source code covered with unit tests. It can vary from 0% to 100%.
While test coverage measures the number of performed tests and monitors the quality of testing, code coverage indicates the percentage of lines of code covered with unit tests.
Why do you need to measure code coverage?
Evaluating code coverage is an essential part of test-driven development, which is based on writing tests before writing code. The idea is to reduce the amount of unnecessary code and avoid bugs.
One of the crucial benefits of analyzing code coverage is that it gives developers an understanding of whether there are enough tests in the unit test suite or whether they should create more tests to cover as many lines of code as possible.
Let’s take a look at the opportunities code coverage evaluation provides to developers:
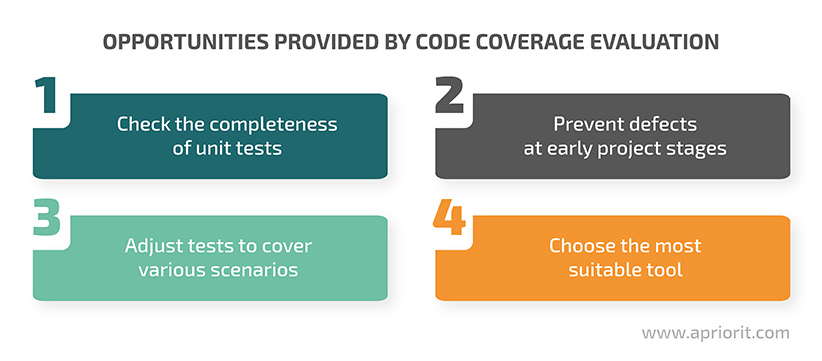
- Check the completeness of unit tests. If code coverage results aren’t satisfying and the percentage of non-covered code is too high, you can add more unit tests to improve the score.
- Prevent defects at early project stages. When analyzing code coverage results, you can find areas of the program that were left unattended during testing. Such code can potentially be dead or useless — or contain bugs.
- Adjust tests to check various sets of input parameters. Passing tests shows that correct performance is possible, but only for a certain set of input parameters. If you change a method, the test can fail. After that, your code coverage score can change and direct your attention to a potential bug or another issue.
- Access a wide selection of tools. You can find commercial and open-source tools to automate the measuring process.
Despite its advantages, measuring code coverage isn’t a silver bullet for checking code efficiency. One of the biggest challenges related to code coverage is interpreting the results.
Complete code coverage doesn’t mean that a project is fully tested. Even an empty method can be 100% covered, but this code is useless. 80% coverage is also a decent result, but there’s a risk that this 80% won’t cover the main scenario.
It’s essential to remember that code coverage results can’t point to flaws in the logic of your code. They also won’t report on the absence of features that should have been implemented.
Read also
How to Detect Vulnerabilities in Software When No Source Code Is Available
Find out how dynamic fuzzing can help your team detect vulnerabilities that remain undiscovered by traditional testing methods.

Another crucial thing is to understand when you should concentrate on a high coverage percentage and when you shouldn’t.
It’s easier to cover more code with unit tests in small and mid-sized projects — and when using test automation. And it’s almost impossible to achieve high code coverage in a large-scale project with complicated logic that can lead to multiple errors. Google has spent more than a decade attempting to refine their coverage infrastructure and validate the most suitable approach.
Covering code with tests can be time-consuming and, therefore, costly. It’s reasonable to do so when you’re already familiar with the entire codebase, have information about recent and planned changes, and know specific requirements. However, if code is old and has gone through multiple changes — and if you don’t have clear requirements on how it should perform — covering it with tests will take lots of time and most likely won’t be very helpful.
Looking to enhance your code quality?
Let our experienced QA specialists help your product achieve maximum performance, maintainability, and performance!
Choosing a tool for checking code coverage
Covering code with unit tests is as time-consuming as creating code. That’s why there’s a wide range of tools, both paid and free, that can accelerate the evaluation of code coverage.
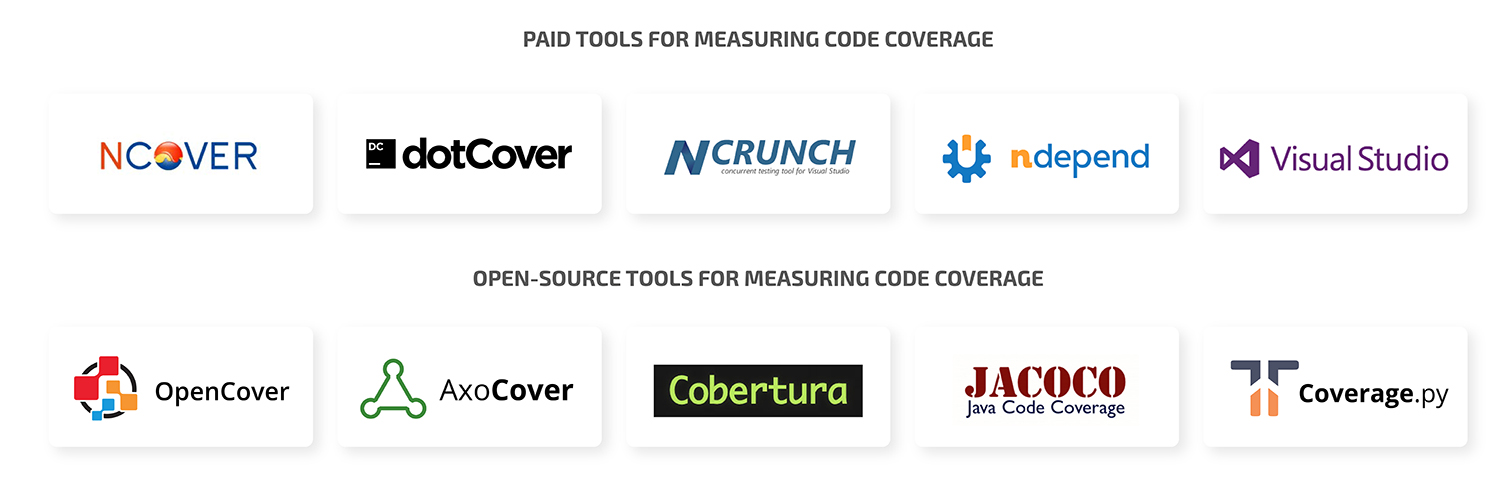
Most tools for measuring code coverage are commercial, like NCover, dotCover, NCrunch, and NDepend. Also, Microsoft Visual Studio is equipped with a convenient code coverage tool with an attractive and intuitive user interface. However, it’s only available in the paid Visual Studio Enterprise version.
On the bright side, there are a fair number of efficient open-source code coverage tools. The most popular are:
- OpenCover — Works on the .NET platforms starting from 2.0
- AxoCover — An extension for Visual Studio that works with OpenCover (not available for Visual Studio versions older than 2017)
- Cobertura — A free tool that calculates the percentage of code executed during tests and identifies which parts of your Java program are lacking test coverage
- JaCoCo — An open-source toolkit for measuring and reporting Java code coverage, distributed under the terms of the Eclipse Public License
- Coverage.py — A tool for measuring code coverage for Python programs
In our projects, we mostly use OpenCover, which has proved its efficiency over the years and has numerous benefits:
- Doesn’t depend on Visual Studio versions
- Works on .NET platforms starting from 2.0
- Provides a detailed report on code coverage results
- Setup is quick and only requires installing a pair of NuGet packages
- Provides flexible parameter settings
- Can be easily launched from a single configuration file without the need for configuring settings each time you run tests
- Supports both 32-bit and 64-bit processors
Now, let’s explore how to evaluate code coverage with the OpenCover tool.
Read also
Test-Driven Development vs Behavior-Driven Development: What is the Difference?
Discover how these approaches can revolutionize your team’s testing, improve product quality, and accelerate time-to-market.
Measuring code coverage with OpenCover
To show you an example of how to measure code coverage, we’ll use the following tools:
- OpenCover
- ReportGenerator
- Visual Studio
- NuGet
- VSTest.Console.exe
Since OpenCover doesn’t have a graphical interface, it can be launched and run only in the console. Its source code can be found on the official GitHub page.
To simplify work with OpenCover results, we usually use the free ReportGenerator tool. ReportGenerator converts code coverage results into readable files in various formats like HTML, Cobertura, and CSV. This tool works with reports created by OpenCover, dotCover, Visual Studio, NCover, Cobertura, JaCoCo, Clover, Gcov, and Lcov.
ReportGenerator will convert an XML file with code coverage results generated by OpenCover into a readable HTML report.
Configuring the tools
Both tools are available for installation through NuGet at the following links: OpenCover and ReportGenerator. We can easily install the required packages in Visual Studio using the NuGet package manager.
Once both tools are installed, we can directly interact with them from the console. They can be called with the following commands:
C:\Users\Alexander\Desktop\Example\packages\OpenCover.4.7.922\tools\OpenCover.Console.exe
C:\Users\Alexander\Desktop\Example\packages\ReportGenerator.4.6.4\tools\net47\ReportGenerator.exeOpenCover doesn’t launch tests directly. Instead, it executes another application that executes tests. We use VSTest.Console.exe as an example of such an application.
VSTest.Console.exe is a Visual Studio command-line tool for launching tests. Physically, it’s located in the folder where Visual Studio is installed, so we can easily access it by the full path name.
The location of VSTest.Console.exe varies depending on your version of Visual Studio.
Here are a few examples:
- Visual Studio 2015
C:Program Files (x86)Microsoft Visual Studio 14.0Common7IDECommonExtensionsMicrosoftTestWindow
- Visual Studio 2017 Enterprise
C:Program Files (x86)Microsoft Visual Studio2017EnterpriseCommon7IDECommonExtensionsMicrosoftTestWindow
- Visual Studio 2019 Professional
C:Program Files (x86)Microsoft Visual Studio2019ProfessionalCommon7IDECommonExtensionsMicrosoftTestWindow
For convenience, you can store the full path to VSTest.Console.exe in a Windows environment variable and access it using that variable’s name.
As a parameter, VSTest.Console.exe can accept a full or relative path to the DLL file with your tests. Running tests from the console looks like this:
C:\Program Files (x86)\Microsoft Visual Studio\2019\Professional\Common7\IDE\CommonExtensions\Microsoft\TestWindow\VSTest.Console.exe C:\Projects\Example\Example.Tests\bin\Debug\Example.Tests.dllOr we can call VSTest.Console.exe by name if we add a full path to it in the Windows environment variables:
set VSTest="C:\Program Files (x86)\Microsoft Visual Studio\2019\Professional\Common7\IDE\CommonExtensions\Microsoft\TestWindow\VSTest.Console.exe"Now, when we want to execute VSTest.Console.exe with the specified parameters, we can do it in the following way:
%VSTest% <params>
If we need to pass VSTest.Console.exe to some command, we can do it like this:
<some command> %VSTest%/
Next, we’ll use the VSTest.Console.exe command (the path to which is stored in the %VSTest% variable) to launch tests. We can start tests with the next command, where the parameter is the address to the DLL build based on the unit test project:
%VSTest% C:UsersAlexanderDesktopExampleUnitTestProject1binDebugUnitTestProject1.dll
Make sure you’ve built the project in debug mode to ensure that all necessary DLL files are created.
Related project
Decentralized Blockchain Application for International Remittance Payments
Explore how Apriorit team designed and delivered a high-quality DApp to drive flexibility and cost-efficiency of our client’s solution.
Measuring code coverage
OpenCover supports a variety of commands. The most frequently used are:
- -target — Sets a path to the target application or the name of the target application or service that will be executed (for example, VSTest.Console.exe)
- -targetargs — Sets parameters to be passed to an application from the -target command
- -output — Defines the path to the generated XML file. By default, a file named results.xml is created in the current directory
- -filter — Introduces a list of filters used to selectively include or exclude assemblies and classes from coverage results
- -register[:user] — A switch to register and deregister the code coverage profiler
Let’s explore how to use the -filter command, which contains a string with filter options. If multiple filter options are supplied, we have to enclose them in double quotes and separate them with spaces (e.g. “+[*]* -[Logic]*Class2”).
There are two types of filters:
- Inclusive options start with the “+” sign
- Exclusive options start with the “–” sign
After putting one of these signs, we have to specify an assembly in brackets [] and add namespaces right after them.
Note that modules, namespaces, and class paths are case sensitive and that exclude filters have a higher priority than include ones.
Let’s take a look at several examples where each command will include or exclude the specified results depending on the sign we put before the brackets:
[Logic]* — Receive all code coverage results from the Logic assembly
[*]Logic* — Get results from any assembly whose path starts with Logic
[Lo*c]* — See results from any assembly whose name starts with Lo and ends with c
[*]*.Class1 — Only receive results that contain Class1 from any assembly
You can find more information on how to use all the commands on the OpenCover GitHub page.
Launching OpenCover with all the necessary parameters looks as follows:
set current_dir=C:\Users\Alexander\Desktop\Example
set VSTest="C:\Program Files (x86)\Microsoft Visual Studio\2019\Professional\Common7\IDE\CommonExtensions\Microsoft\TestWindow\VSTest.Console.exe"
set NUGETFolder=C:\Users\Alexander\Desktop\Example\packages

"%NUGETFolder%\OpenCover.4.7.922\tools\OpenCover.Console.exe" -target:%VSTest% -targetargs:"%current_dir%\UnitTestProject1\bin\Debug\UnitTestProject1.dll" -output:"%current_dir%\CoverageResults.xml" -register:user -filter:"+[Logic*]*"The variables used in the code above are:
- current_dir — The variable with the path where the Example project is located
- set VSTest — The variable with the path where VSTest.Console.exe is located
- NUGETFolder — The variable with the path where the OpenCover and ReportGenerator folders are located
The result of code coverage evaluation in an XML file will look like this:
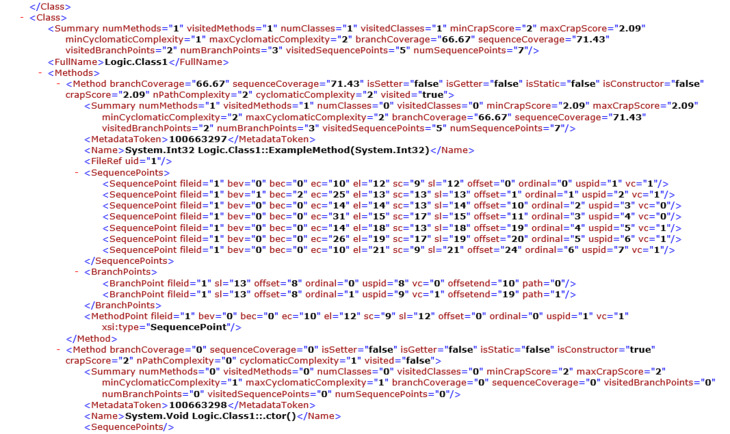
Code coverage results by OpenCover
Now it’s time to launch the ReportGenerator tool and turn our code coverage results into a readable HTML report. All you need to do is pass the two following parameters:
- reports: — The path to the XML file previously generated by OpenCover
- targetdir: — The path to the folder where the HTML pages will be generated
Enjoy the results!
Let’s see how this works in practice using the example of the previously received XML file:
"%NUGETFolder%\ReportGenerator.4.6.4\tools\net47\ReportGenerator.exe" -reports:"%current_dir%\CoverageResults.xml" -targetdir:"%current_dir%\CoverageReport"Once file conversion is complete, we’ll get an HTML page with code coverage results.
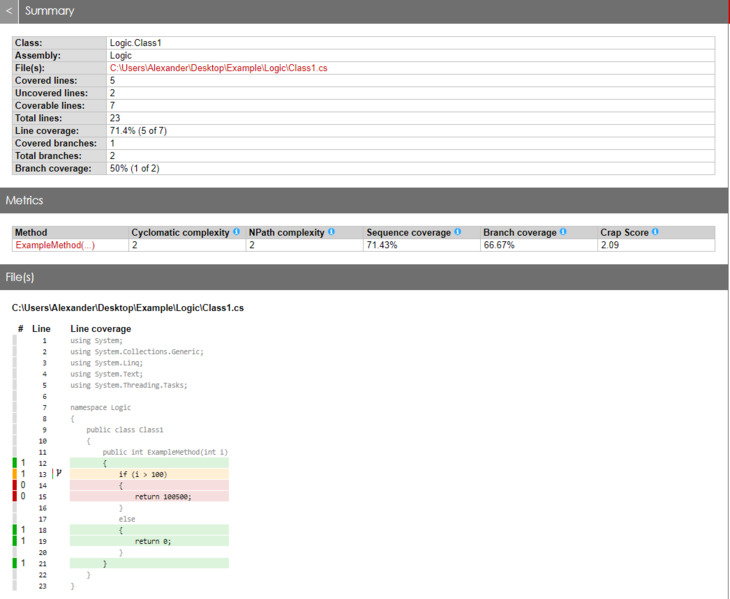
Code coverage results converted to an HTML file by ReportGenerator
Now we can identify the code that wasn’t covered with unit tests and create tests for it. However, it’s essential to remember that code coverage results can’t be considered as confirmation that a program performs correctly with all possible parameters.
Conclusion
Measuring code coverage is an essential practice that helps developers understand which lines of code are covered with unit tests and which tests they need to add to improve the results. However, it’s worth keeping in mind that evaluating code coverage can’t help you detect logical flaws. Additionally, even a 100% score doesn’t mean that the project is fully tested.
Using the OpenCover code coverage tool together with ReportGenerator gives you a number of benefits. In particular, you can put all the settings in a single executable file and launch it to get a complete readable report with a level of detail down to each line of code. Also, these tools are free to use and fast to set up.
At Apriorit, we have experienced teams of software developers and QA specialists ready to help you create a bug-free product from scratch or improve an existing one. Contact us to start working on your dream project.
Looking for a star QA team?
Harness our unique expertise in quality assurance to provide your product with immaculate performance, reliability, and security!
Have a question?
Ask our expert!
VP of Engineering


