 Skip to main content

Monitoring system calls (syscalls) and analyzing system behavior can help you debug your products and improve their performance, security, and compliance. However, monitoring syscalls in Windows has its challenges due to a lack of built-in tools and the need for niche knowledge of reverse engineering and application behavior analysis.
In this article, we discuss some of the core approaches to monitoring system calls in Windows. In particular, we share Apriorit’s experience how to monitor syscalls in Windows using DTrace.
This article will be useful to development teams and project managers looking for ways to safely analyze Windows behavior in order to improve their products and services.
Contents:
Monitoring system calls in Windows: what to look at and why
A syscall is a mechanism enabling programs to request various types of services and tasks from the operating system’s kernel. System calls provide a secure and controlled way for user-level programs to access system resources without compromising the stability or security of the operating system (OS). When executing a requested operation, a system call transfers control between user and kernel modes.
System calls are a standard part of ring-0/ring-3 isolation. Let’s look closer.
In an operating system, there are two code environments:
- Kernel code (ring 0) that runs with full privileges
- User code (ring 3) that runs with limited privileges
Between these environments, there’s a system call interface.
The divide between ring 0 and ring 3 — the kernel and user levels — is the best point at which to observe an application’s behavior and raw actions. When code has reached the level of system calls, the application can’t obfuscate its actions. For example, if user-level code calls the CreateFile() function covertly, you’ll still be able to detect this by monitoring system calls, as you’ll see the execution of the NtCreateFile syscall.
For the majority of popular architectures, including x86, AMD64, ARM64, and PowerPC, the approach to working with system calls is the same:
- At the user level, a set of system APIs act as wrappers over system calls.
- At the kernel level, a kernel API implements handlers for system calls and is used by kernel drivers.
In some architectures, system calls are called system services.
Common examples of syscalls in Windows include:
- File input/output (I/O) operations, such as reading from or writing to a file
- Process management, such as creating a new process or terminating an existing one
- Memory management, such as allocating memory
- Interprocess communication, such as sending or receiving messages between processes
- Device driver operations, such as sending commands to a hardware device
Why may your developers need to monitor system calls?
Windows system call monitoring is essential for researching multi-layered software and analyzing the behavior of applications with obfuscated code. Using this approach, you can determine how a particular application behaves without needing to analyze the code at each level of the application.
Common reasons for monitoring syscalls include:
- Debugging — Track down issues in your application, identify their root cause, and fix bugs quickly.
- Performance optimization — Identify bottlenecks and optimize problematic sections of code to improve overall performance.
- Security — Detect suspicious, potentially malicious behavior and take steps to prevent it.
- Compliance — Ensure that an application complies with relevant requirements by analyzing the way the application accesses and uses specific types of data.
However, there are multiple challenges to applying this approach in practice. It requires a deep understanding of OS specifics and niche knowledge of reverse engineering and application behavior analysis. In the next section, we discuss key issues your developers might face when trying to monitor system calls in Windows, based on experience of Apriorit’s specialists.
Plan to improve the performance of your existing solution?
Benefit from Apriorit’s professional reverse engineering skills and establish appropriate solution debugging, security, and compliance.
Syscall monitoring challenges in Windows
In contrast to Linux, which has the strace tool for monitoring system calls in any process, Windows has no built-in tools for this task due to security reasons. However, prior to Windows XP, any software that needed to monitor or control user-level code — such as antivirus software — could set hooks in two tables:
- System Service Descriptor Table (SSDT)
- Shadow System Service Descriptor Table (Shadow SSDT)
These tables contain pointers to the kernel functions that handle specific system calls.
Setting hooks in SSDT and Shadow SSDT caused lots of conflicts and instability, leading to reputational damage for Windows and making it look like an unreliable operating system. In addition to that, rootkits and viruses were able to set hooks in SSDT and Shadow SSDT. That’s why Microsoft was forced to block access to these tables and, starting from Windows XP, implemented PatchGuard, also known as Kernel Patch Protection. Since then, system monitoring tools have only been able to set callbacks for a small set of kernel events, making the monitoring of system calls very challenging.
Below, we discuss how to monitor system calls in Windows and explain a safe and efficient approach to analyzing program behavior in Windows.
Read also
A Comprehensive Guide to Hooking Windows APIs with Python
Discover how to apply API hooking to achieve a better understanding of a system’s work, alter an app’s behavior, detect malicious code, and build secure products.

Monitoring Windows syscalls with XPerf
In Windows XP, Microsoft introduced the Event Tracing for Windows (ETW) mechanism for detailed event logging used by the XPerf tool. The latter is now a part of the Windows Performance Toolkit.
In general, Microsoft placed ETW callbacks all over Windows subsystems to be able to trace low-level events. Using ETW, you can obtain system events, so XPerf might also be useful for monitoring syscalls.
Let’s see how you can use XPerf to monitor system calls in Windows.
First, we queried ETW providers to see if there was anything related to system calls:
logman.exe query providers In the information we received from XPerf, there was nothing that looked like a system call. Going to TraceView and monitoring kernel provider events with names like Microsoft-Windows-Kernel-* also brought us various kinds of kernel events but no results regarding system calls.
The next possibility was to use SystemTraceProvider — a kernel provider that traces kernel events. After adding the GUID of this provider to TraceView, we still had no results.
Looking for possible alternatives to setting hooks, we tried different approaches to monitoring system calls in Windows, including hooking SSDT functions via a hypervisor and using undocumented parts of Event Tracing for Windows.
Related project
Improving a Windows Audio Driver to Obtain a WHQL Release Signature
Explore a success story of how we helped IRIS release a secure Windows version of the noise reduction app and add localization to reach out to even more customers across the globe.

Monitoring Windows syscalls with Syscall Monitor and InfinityHook
Searching for an alternative solution, we decided to take a look at less documented ways of monitoring system calls.
Disclaimer: The following actions were performed for research purposes only.
After researching several possibilities, we found two promising projects on GitHub:
Let’s start with testing the Syscall Monitor tools. This project uses Virtual Machine eXtensions to hook SSDT functions via the hypervisor. The method itself works and makes monitoring system calls in Windows possible. Unfortunately, the author decided to implement the tool as an alternative to ProcessMonitor. Thus, Syscall Monitor is limited in its abilities and can only monitor a fraction of system calls:
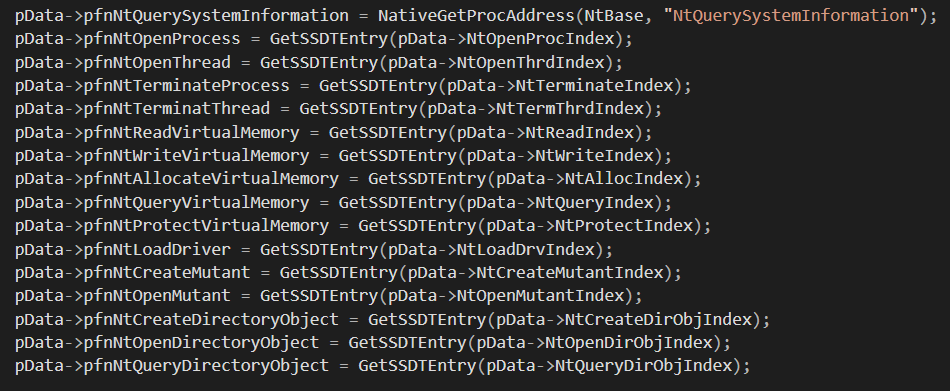
To sum up, Syscall Monitor is a nice tool to start your research of SSDT hooks but won’t be useful if you want to monitor things like Graphical Device Interface (GDI) syscalls.
Now, let’s move on to testing the use of the InfinityHook tool. According to the tool’s description, you need to understand the basics of ETW before using it.
For monitoring syscalls in Windows, InfinityHook uses the undocumented part of ETW tracing in the kernel code of system call handlers. It’s noteworthy that the project can’t be easily built out of the box, and we had to implement some minor changes before we managed to run the code. As the result, however, we got the BSOD:
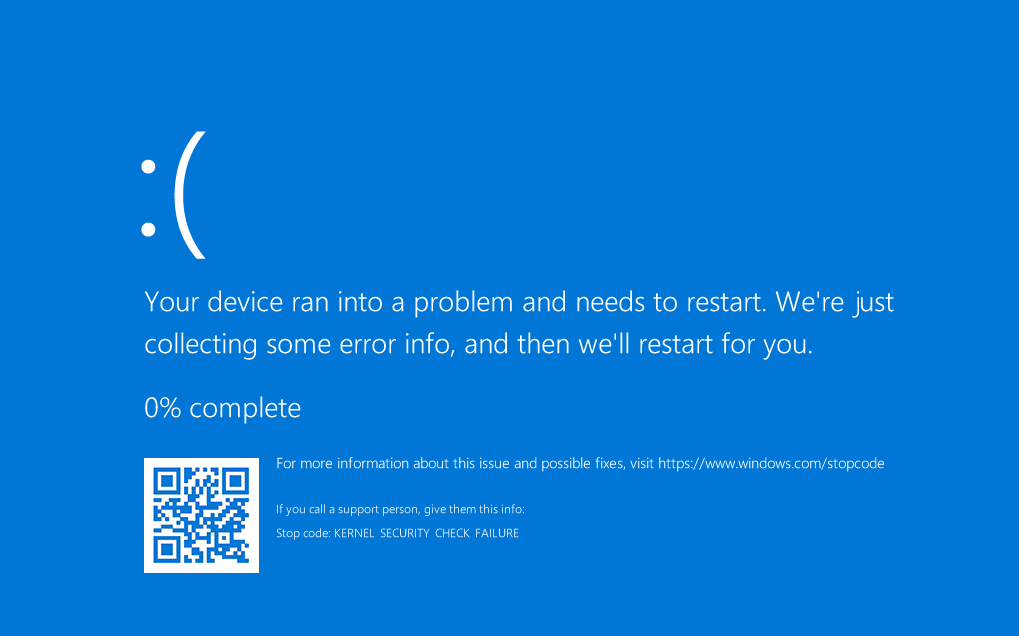
As you can see from the screenshot above, we received an error message saying “Stop code: KERNEL_SECURITY_CHECK_FAILURE.” This message means that Kernel Patch Protection was triggered. Apparently, recent versions of Windows protect kernel ETW provider callbacks from modifications, so for monitoring Windows syscalls, we need to disable PatchGuard.
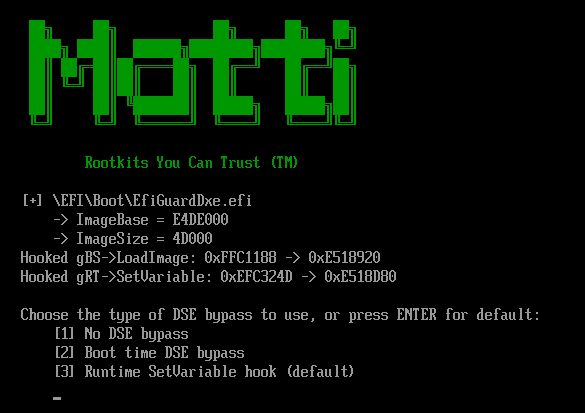
One way to disable PatchGuard in Windows 10 is by using the EfiGuard project. Following the instructions from GitHub, we used a floppy disk image to boot into a VMWare instance of Windows 10 that we use for such research and experiments:
We tried several different Driver Signature Enforcement bypass methods, but the result remained the same — we still got the BSOD triggered by Kernel Patch Protection. After additional investigation, we determined that EfiGuard works successfully on a different Windows build — specifically, Windows 10 build 1511.
We then created a new VMWare image with Windows 10 build 1511 installed on it and tried using EfiGuard to disable PatchGuard once more. This time, our attempt was successful and we finally managed to run the InfinityHook project.
InfinityHook prints information about system calls from the driver using the DbgPrint() function. Therefore, we needed to use the DebugView tool to view its logs.
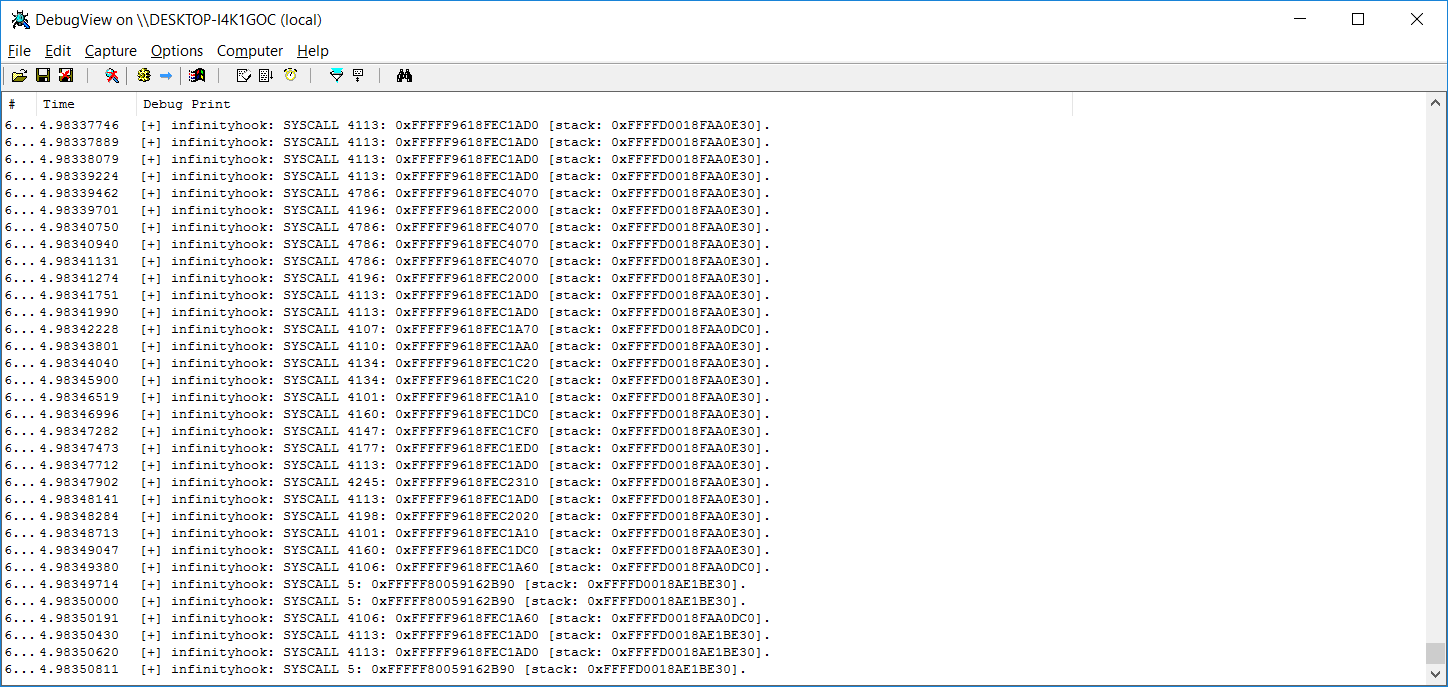
As you can see from the screenshot above, InfinityHook provides the following data:
- System call index
- EPROCESS value
- Stack pointer for the system call
System calls with an index over 4000 are GDI calls. To properly map the indexes to names of system calls, you’ll need to know system call indexes relevant to the kernel version that your machine runs on. You can also try using one of the system call tables available on the internet for further research.
However, as this approach requires extra effort, we tried looking for a more convenient and safer way to monitor system calls in Windows. In the next section, we discuss in detail how to use DTrace for monitoring Windows syscalls.
Read also
A Comprehensive Guide to Hooking Windows APIs with Python
Discover how to apply API hooking to achieve a better understanding of a system’s work, alter an app’s behavior, detect malicious code, and build secure products.
Monitoring Windows syscalls with DTrace
DTrace is a dynamic tracing framework that allows developers to analyze system behavior in real time in both user mode and kernel mode. This framework was originally developed by Sun Microsystems for the Solaris operating system and later ported to other Unix-like operating systems such as macOS and Linux.
Currently, Microsoft also supports DTrace, enabling developers and software researchers to monitor syscalls on 64-bit platforms starting from Windows 10 Build 1903. However, this tool can only capture traces of 64-bit processes.
The DTrace on Windows page on GitHub contains easy-to-follow instructions on how to install it, so we’ll omit this part in our overview.
By default, the system places DTrace in the C:\Program Files\DTrace folder. To work with it, you need to run the following command as Administrator:
dtrace -ln syscall:::Once you run this command, DTrace should print the list of system calls available for monitoring in your system.
Note: Each system call will be printed twice because you can monitor both syscall arguments and their returned values.
Next, run the following script written in the D language to continue syscall monitoring:
syscall:::
  /pid == 9140/
  {
	printf ("%s called\n", execname);
}This particular script prints all syscalls from the process with PID = 9140. By changing the PID, you can monitor system calls for any other processes you’re interested in.
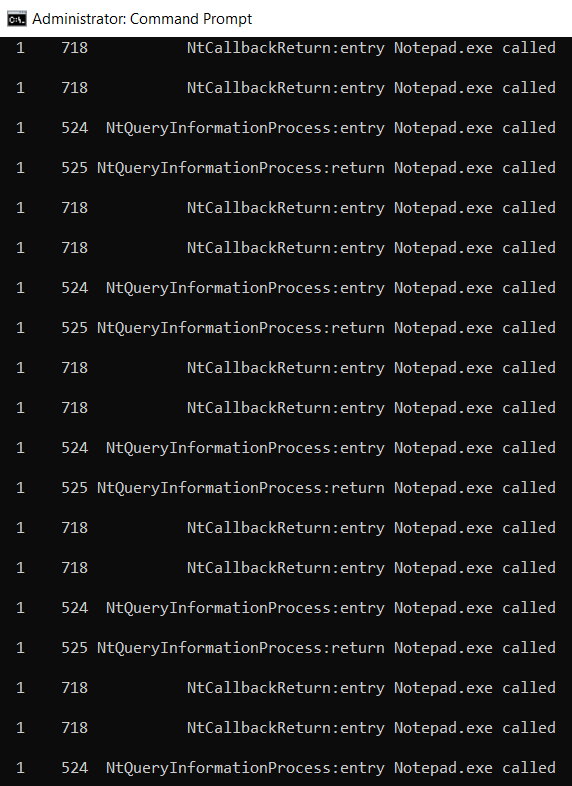
Save the script as a test.d file and then you can run it with a simple command:
Dtrace -s test.dTo see how this works, let’s run the script for Notepad. We receive the following result:
You can stop monitoring Windows syscalls with DTrace at any moment by pressing Ctrl+C.
To learn more about using DTrace scripting and possible methods for system monitoring, you can explore the examples provided by Microsoft on the DTrace GitHub page.
Conclusion
Monitoring system calls can provide valuable insights into an application’s behavior and performance, which can help developers create more reliable, efficient, and secure applications. To monitor system calls in Windows, you can use the DTrace implementation officially supported by Microsoft.
At Apriorit, we have experts in reverse engineering and system behavior analysis with the skills necessary to build quality, secure, and well-performing products.
Need help with a non-trivial project?
Handle tricky tasks to our experienced reverse engineers and Windows developers. Enjoy a smooth delivery of your secure and efficient product within established deadlines.
Have a question?
Ask our expert!
Program Manager


