 Skip to main content
Optimizing the performance of your web applications is crucial to stay ahead of the competition and provide a great user experience to your customers. One way to achieve this is through monitoring web application performance, which involves collecting and analyzing data on key metrics of your web application’s performance.
In our experience, the combination of JMeter, Grafana, Telegraf, and InfluxDB is great for monitoring web application performance. It allows you to track key metrics of your web app and visualize them in a way that is easy to understand.
In this article, we introduce you to web application performance monitoring frameworks and walk you through the main stages of setting up the JMeter-Grafana-Telegraf-InfluxDB technology stack. This article will be useful for project leads who are looking for an effective way to optimize their web application or software.
By the end of this guide, you will have a solid understanding of how to use a software performance monitoring framework to optimize your web application and stay ahead of the competition.
Contents:
- Monitoring web application performance
- Working with the JMeter-Grafana-InfluxDB-Telegraf framework
- Setting up the JMeter-Grafana-InfluxDB-Telegraf framework
- Step 1. Preparing the framework and installing all components
- Step 2. Creating and configuring a test plan in JMeter
- Step 3. Connecting InfluxDB to JMeter
- Step 4. Configuring data sources in Grafana
- Step 5. Creating dashboards in Grafana
- Conclusion
Monitoring web application performance
Web app performance monitoring is an important practice that focuses on evaluating and optimizing the speed, responsiveness, and general user experience of a web application. To collect and analyze these indicators, you need a web app performance monitoring framework. This framework presents a collection of key metrics that help quality assurance professionals understand how well a particular web application performs. It’s an important tool for managing web applications, especially those with high traffic volumes.
Typically, a web application performance monitoring (APM) framework can provide valuable insights into the following metrics:
- Response time
- Error rate
- Throughput
- Database performance
- Network latency
- And others
Why use performance monitoring frameworks?
Today, most quality assurance teams use monitoring tools to track the performance of their web apps and software. These tools allow QA specialists to identify and fix performance issues proactively, preventing potential downtime and keeping systems running smoothly.
Here are five key benefits of introducing a web application performance monitoring framework into your QA process:
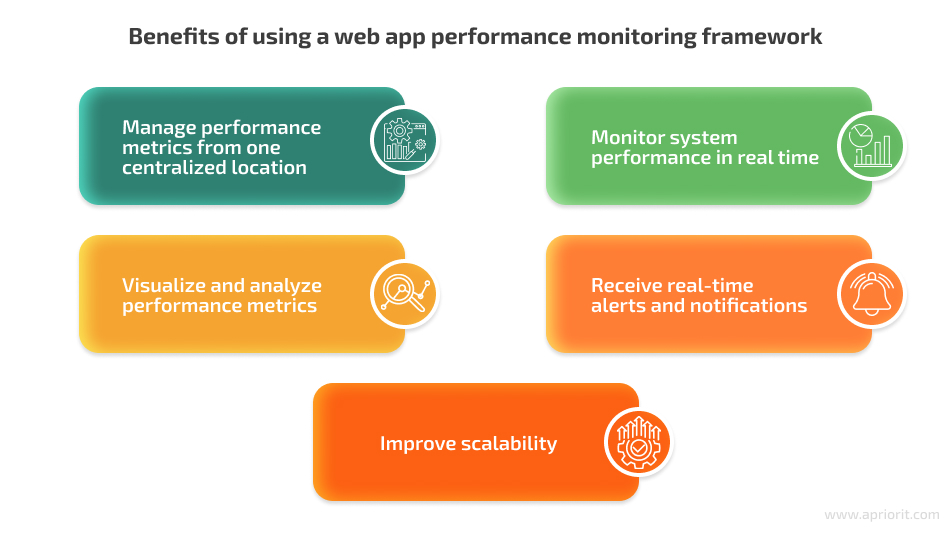
- Manage performance metrics from one centralized location. With a performance monitoring framework, you can manage all your performance testing activities from a single location. Centralization makes it easy to monitor multiple systems and applications simultaneously and to improve collaboration within your team.
- Monitor system performance in real time. You can observe how your system behaves during a load test, identify performance bottlenecks as soon as they occur, and fix them immediately.
- Visualize and analyze performance metrics. Data visualization features help you make sense of the large volume of performance data collected during load testing. Also, you can receive advanced analytics that help you identify the root causes of performance issues and optimize your system as a result.
- Receive real-time alerts and notifications. Many performance monitoring frameworks have the ability to send alerts and notifications when certain performance thresholds are breached. This allows you to quickly take action to prevent potential performance issues from becoming critical.
- Improve scalability. APM frameworks are designed to be highly scalable, making it possible to collect and analyze performance data from large and complex systems. This ensures that you can monitor the performance of your system regardless of its size or complexity.
Ready to secure the future of your software?
Reach out to Apriorit to level up your quality assurance game. We’ll pick the most suitable testing tools and approaches to help you establish high performance and reliability for your software.
Working with a web application performance monitoring framework: key stages
Let’s take a look at the key stages for using a framework to monitor and analyze your application’s performance metrics.
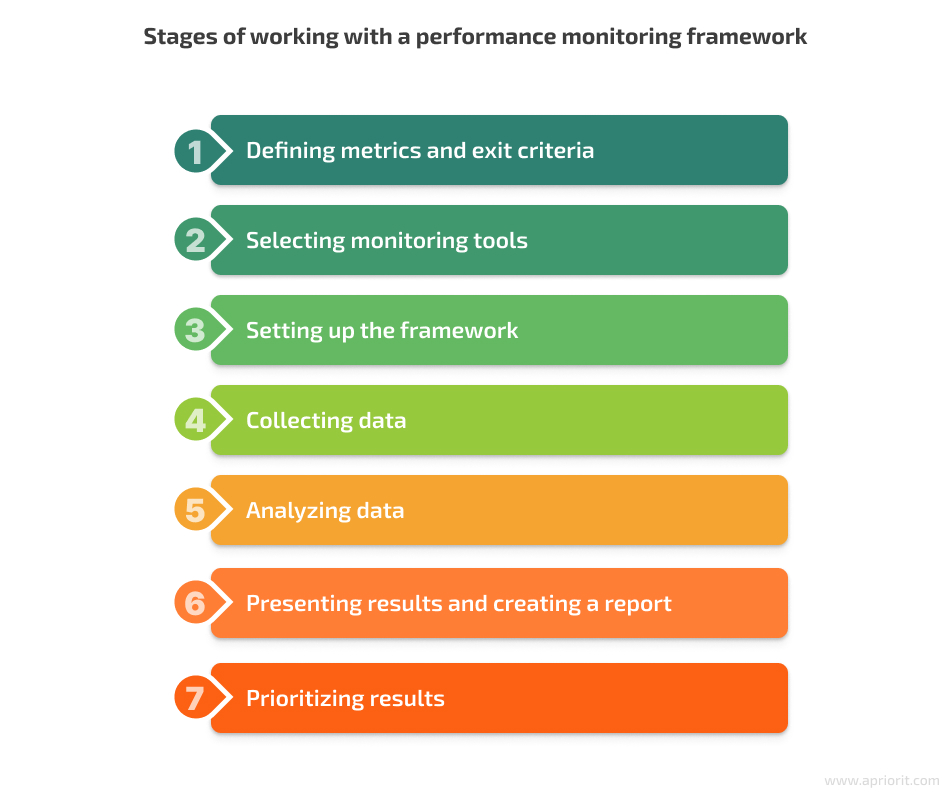
Stage 1. Determining main metrics and exit criteria
Chosen performance metrics should be closely related to the primary objectives. They should be regularly tracked and used to inform stakeholders. Metrics are determined when forming the performance testing strategy.
Definition of done: A list of metrics and an approach to their analysis and monitoring have been documented in the testing strategy. Performance indicator requirements are clearly defined and documented in the test plan and test strategy as exit criteria.
Stage 2. Selecting monitoring tools
The tools you should choose for monitoring system performance depend on the testing context, technologies used, target metrics, general testing objectives, and overall budget.
Definition of done: An analysis of existing services for monitoring systems has been conducted. The optimal set of tools has been selected and justified for the specific system.
Stage 3. Setting up the framework
The framework is set up and configured based on the selected monitoring tools. The framework should be able to collect, store, and analyze performance metrics from different sources, including server-side metrics, application-side metrics, and client-side metrics. In this article, we focus on this stage in detail.
Definition of done: All services have been installed and configured on the target system. The framework is ready for data collection and analysis.
Stage 4. Collecting data
Data sources are combined into a well-structured data repository. Data is collected from these sources, with all relevant information included. Performance monitoring tools are configured to collect data at the required intervals.
Definition of done: The selected performance monitoring tool has been integrated with the corresponding data source, which was configured during step three. Any potential issues with the data collection process have been identified and addressed. Data is collected accurately and consistently.
Stage 5. Analyzing data
Data collection serves as the basis for further study and analysis. Analysis should help in achieving the goals described in the testing strategy. Full interaction with the business is necessary to maintain relevant metrics.
Definition of done: Data sets have been formed both to provide regular reports (e.g. monthly) and to achieve an initial understanding of the effectiveness of performance metrics.
Stage 6. Presenting results and creating a report
Presenting test results to stakeholders is crucial. This stage requires strong design skills and an understanding of visualization principles.
Definition of done: A report has been created with the required balance of detail and abstraction in line with stakeholder involvement. The report includes specific components (such as performance indicators, where metrics are shown as comparable results) that demonstrate the main research findings. Key conclusions have been drawn on achieving the target level of performance quality. Testing results are clearly outlined, problems and deviations from target metric indicators have been identified, and system weaknesses have been recorded.
Stage 7. Prioritizing results
The results of performance testing should be oriented toward different target stakeholder audiences. The results should also provide contextual information, including information to justify prioritizing actions.
Definition of done: Defects with specific expected results have been recorded, and recommendations for system optimization have been formed and prioritized.
In the next section, we take a closer look at Stage 3 of working with web application performance monitoring frameworks, which is setting up the framework itself. Specifically, we explain how to set up and configure all tools for creating a JMeter-Grafana-InfluxDB-Telegraf performance monitoring framework. We also discuss what tasks you can solve with this particular combination of tools.
Read also
How to Shift from Performance Testing to Performance Engineering and Why You Should Do So
Want to boost the productivity and reliability of your software? Start prioritizing performance from the start of product development by adopting performance engineering. Find out the tips and tricks for using this approach to enhance your software quality features.

Working with the JMeter-Grafana-InfluxDB-Telegraf framework
An effective framework should include tools for data collection, visualization, analysis, and reporting. Web application performance testing using JMeter-Grafana-InfluxDB-Telegraf has proven very effective. These tools are highly customizable, so you can use this combination of tools for a wide range of applications.
While this framework offers a versatile and well-established combination of tools, it might not be the best fit for every organization. For instance, when you know how to automate performance testing using JMeter, it becomes a great solution for simulating high loads, which means that JMeter shows the best results with high-performance applications. Also, this framework may not be suitable in cases where data storage requirements are not time-stamped.
Setting up all your data sources may take some time. But doing so will allow you to use the performance monitoring framework consisting of these components:
Apache JMeter is a popular open-source tool designed to test an application’s load and performance, and to measure the functional behavior of web apps and APIs. You can use it to simulate heavy loads on server-side applications, analyze and measure the performance of a variety of protocols and server types, and generate customized test plans and reports.
JMeter version 3.2 introduced the InfluxDBBackendListenerClient, which allows you to send metrics to the InfluxDB backend using the UDP or HTTP protocols. After that, the metrics are stored in the InfluxDB database. This feature provides:
- Live testing results
- Visual graphs
- Ability to compare benchmarks
- Option of adding annotations to graphs
- Storage of monitoring data as long as JMeter leads to the same backend
In our framework, we use JMeter as a load generator with a model and load profile that corresponds to different types of performance testing tasks.
InfluxDB is a distributed time-series database that is mainly used for storing monitoring data, metrics, real-time analytics, and other time-based records.
In our framework, InfluxDB acts as a link between JMeter and Grafana, storing the data received from JMeter and redirecting it further to Grafana.
Telegraf is a plugin-driven server agent that collects server-side metrics and sends them to a database, which in this case is InfluxDB. Telegraf supports over 200 plugins for many systems, including databases, web servers, messaging systems, and cloud providers. It also has a small memory footprint and low CPU usage, making it perfect for monitoring high-traffic production environments without adding extra overhead.
In our framework, Telegraf is responsible for collecting data from JMeter and sending it to InfluxDB.
Grafana is an open-source platform for time series analysis. This platform allows you to create real-time graphs based on time series data. Grafana supports various data sources, such as Graphite, InfluxDB, MySQL, and others.
Grafana is responsible for visualizing the received data within the presented framework.
In our experience, monitoring and performance testing using the JMeter-Grafana-InfluxDB-Telegraf framework has proven effective. Here are some of the things that your QA team can do with the help of this framework:
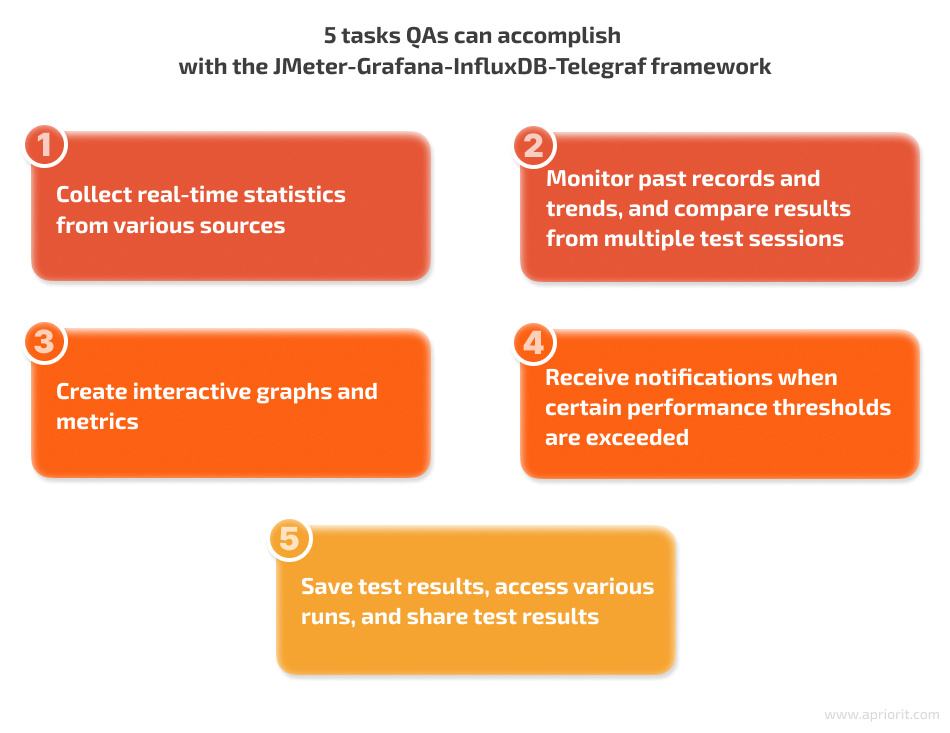
1. Collect real-time statistics from various sources. You can collect real-time statistics from various sources, including server-side metrics (CPU, memory, network, disk load), application-side metrics (response time, error rate, throughput), and client-side metrics.
2. Monitor past records and trends, and compare results from multiple test sessions. This framework allows you to evaluate changes in the system: for example, a software update or hardware upgrade. You can also see if applied changes positively or negatively affect overall performance.
3. Create interactive graphs and metrics. With this framework, you can visualize performance data in real time. Grafana offers a lot of visualization options, such as bar charts, line charts, tables, and gauges.
4. Receive notifications when certain performance thresholds are exceeded. You can set notifications through email, Slack, and other channels by configuring alert rules in Grafana. For example, all stakeholders and team members can get a notification if the website response time exceeds a certain limit or if there are too many errors.
5. Save test results, access various runs, and share results. Test results are stored in the InfluxDB database, and you can access and analyze this data through Grafana at any time. This way, every team member can stay informed about the status of the system’s performance.
In the next section, we explain how to set up the JMeter-Grafana-InfluxDB-Telegraf framework, connect all components, and visualize JMeter test results in Grafana.
Read also
How to Use Apache JMeter for Web Application Performance Testing
Explore our comprehensive tutorial about configuring and using Apache JMeter effectively for boosting web application performance. Our experts share practical advice to optimize performance testing processes using one of the most popular multi-user application testing tools.
Setting up the JMeter-Grafana-InfluxDB-Telegraf framework
Here is what you need to do to start using this framework for web app performance testing with JMeter and other tools:
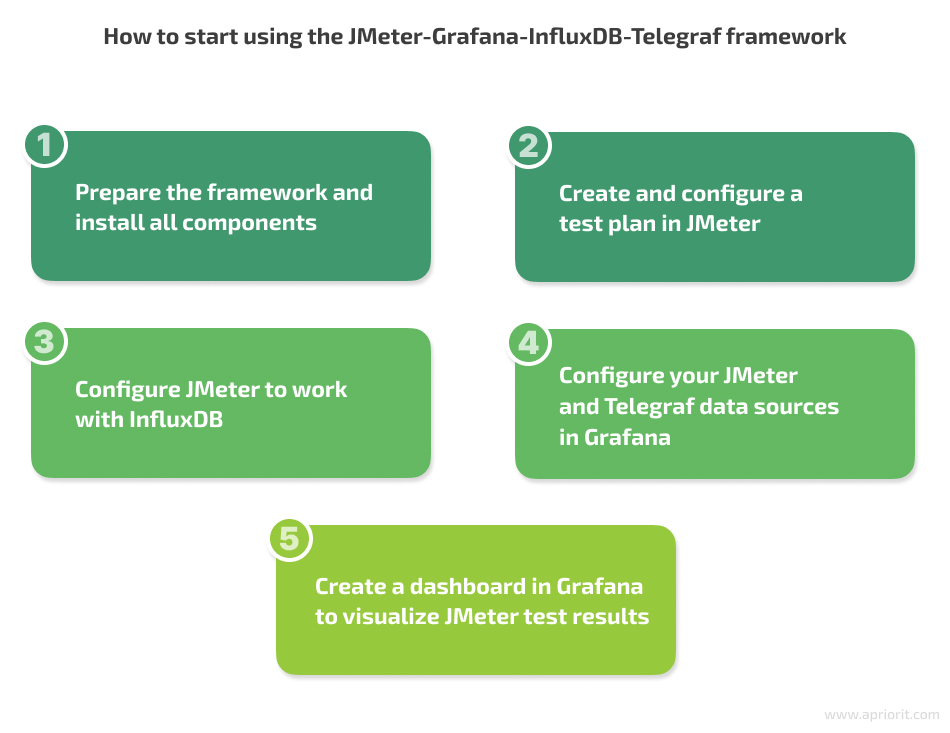
Let’s explore each of these steps in detail.
Step 1. Preparing the framework and installing all components
You can work with Grafana in the cloud using a Docker container, or you can install Grafana locally on your computer. Grafana is compatible with Windows, Linux, and macOS. In this section, we explore how to install Grafana on Windows.
To install Grafana on Windows, you can use one of two options:
- A standalone Windows binary file
- A Windows installer package
Here is what you need to do to install Grafana with a standalone Windows binary file: First, go to the Download Grafana page and select the Grafana version you want to install. The most recent version is selected by default. There are also two editions to choose from:
- Open Source, which has a basic feature set
- Enterprise, which has the Open Source feature set plus additional features that you can unlock with a license, such as increased security and access controls and advanced data source integrations
After that, click on the Windows option and start downloading the Grafana Windows binary file. Open the downloaded file and continue with the installation process according to the instructions.
To install Grafana with the help of the Windows installer package, you need to download the installer and run it. After that, to run Grafana, open your browser and go to the Grafana port (http://localhost:3000/ is the default) and follow the instructions in Getting Started.
To install InfluxDB, you need to do the following:
- Go to the InfluxDB Downloads page.
- Select the version of InfluxDB that you want to download (e.g. InfluxDB 2.0), your operating system, and your architecture.
- Download and extract the archive contents to the directory of your choice.
- Run the InfluxDB server by executing the
influxdbcommand in the command prompt or terminal window. - Verify the installation by navigating to the InfluxDB URL. By default, the database is located at http://localhost:8086/.
To install Telegraf, download the Telegraf agent from the Telegraf page. Unzip the downloaded file and navigate to it using the command line. Follow the instructions to complete the installation.
These are the basic steps for installing all tools you will need for this framework. Next, we show how to connect JMeter to InfluxDB so you can store your metrics in a centralized location and access them for further analysis.
Step 2. Creating and configuring a test plan in JMeter
To get detailed instructions on ways to create and configure a test plan in JMeter, you can refer to the How to Use Apache JMeter for Web Application Performance Testing article on our blog.
You can create a test plan manually or by using HTTP(S) Test Script Recorder to speed up the process and reduce the risk of human errors.
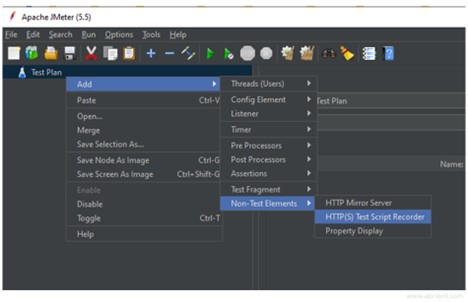
By creating a test plan, you can define the performance metrics that will be collected and analyzed, set up test scenarios, and determine the expected results. This information is crucial for further configuration of JMeter for collecting and storing performance data in InfluxDB.
Related project
Supporting and Improving Legacy Data Management Software
Discover how Apriorit enhanced legacy data management software for content-critical businesses. As a result of our collaboration, the client managed to support and improve their existing software while transitioning to a new cloud-based platform.

Step 3. Connecting InfluxDB to JMeter
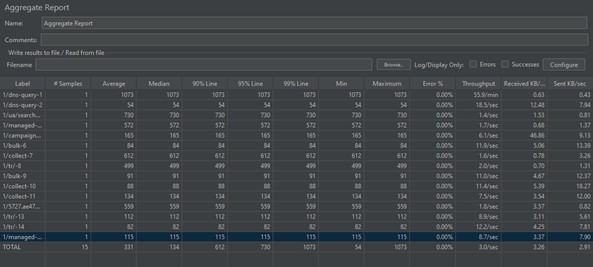
JMeter provides built-in tools to collect performance metrics. However, they can be complex to work with. In particular, the reports you get using these tools are static, which makes it hard to visualize and analyze test results.
Once you’ve created a test plan in JMeter, you can start configuring JMeter to send data to InfluxDB:
1. Unzip the InfluxDB folder that you downloaded in the first step. The InfluxDB Service is launched on port 8086 by default. To change the port, go to the InfluxDB folder and open the influxdb.conf file. Then change the bind address in “The bind address used by the HTTP service” line.
2. Run influxd.exe and minimize it.
3. Next, run influx.exe, which will open the InfluxDB command line.
4. Open JMeter with your test plan, add the Backend Listener to the test plan and select InfluxdbBackendListenerClient from the Backend Listener Implementation dropdown menu.
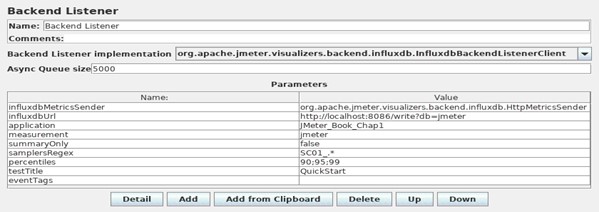
5. Change influxdbUrl; the default value is http://host_to_change:8086/write?db=jmeter. Replace host_to_change with the IP or domain name, or use http://localhost:8086/write?db=jmeter if you deploy services locally.
6. Change summaryOnly from true to false to separate data by operations.
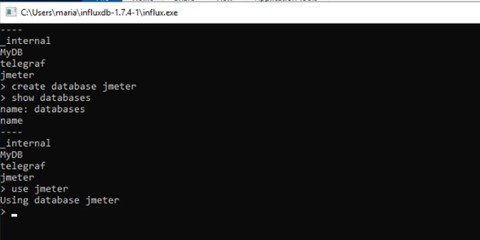
7. Execute the create database jmeter command in the InfluxDB command line.
8. Run the JMeter test script and wait for it to finish.
9. In the InfluxDB command line, enter the show databases command. The JMeter database should appear.
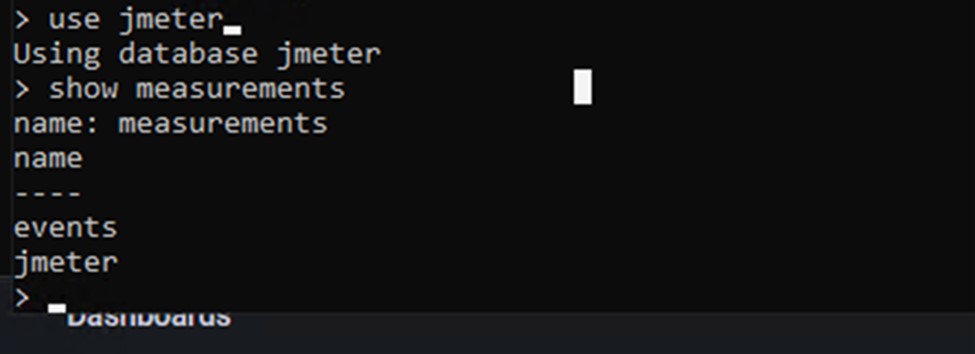
10. Enter the use jmeter command to specify what database should be used.
11. Execute the show measurements command. After that, two tables will appear:
- events: a table with two values — test start and end times
- jmeter: a table used to record metrics
In order to verify if InfluxDB is configured correctly, you need to execute SELECT * FROM events and SELECT * FROM jmeter limit 5 queries in the InfluxDB command line.
Now that you have all components in place for performance monitoring using JMeter-Grafana-InfluxDB-Telegraf framework, it’s time to configure data sources to work together with Grafana.
Step 4. Configuring data sources in Grafana
Let’s see how to configure Grafana with JMeter, configure JMeter to use InfluxDB as its data source, and make Telegraf collect and send metrics to InfluxDB. Correctly configuring these data sources is important for monitoring the performance and health of application servers. Together, these sources can provide server performance monitoring using JMeter and visualize metrics in Grafana so you can perform timely troubleshooting and optimization.
Here is how you can perform a JMeter-Grafana-InfluxDB integration:
1. Open Grafana and select the source from which data will be taken. In our case, it’s InfluxDB.
2. Enter the name of the resource in the Name field. In our case, we are working with JMeter, so we enter “jmeter” in the Name field (see Screenshot 5 below), but you can use any name in your project.
3. In the HTTP section, enter the IP address of the server where the InfluxDB database or other resource is located. InfluxDB uses the usual HTTP API for executing queries, which is available on port 8086. Thus, if you installed the database on your local computer, the address would be http://localhost:8086.
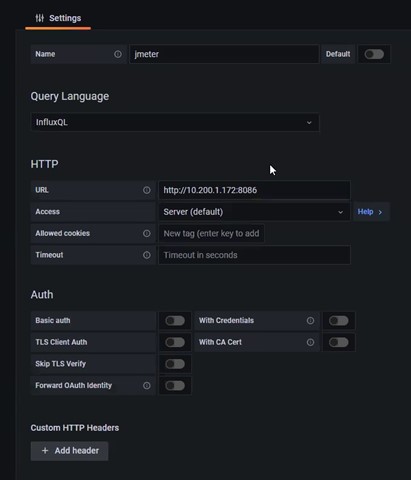
4. In Grafana’s InfluxDB Details section, enter the name of the ‘jmeter’ database in the Database field. Click Save. If everything is successful, you will see the message “Data source is working.”
After successfully completing Grafana integration with JMeter data source, you need to add the Telegraf data source for reading application server metrics to Grafana as well. Here’s how to do it:
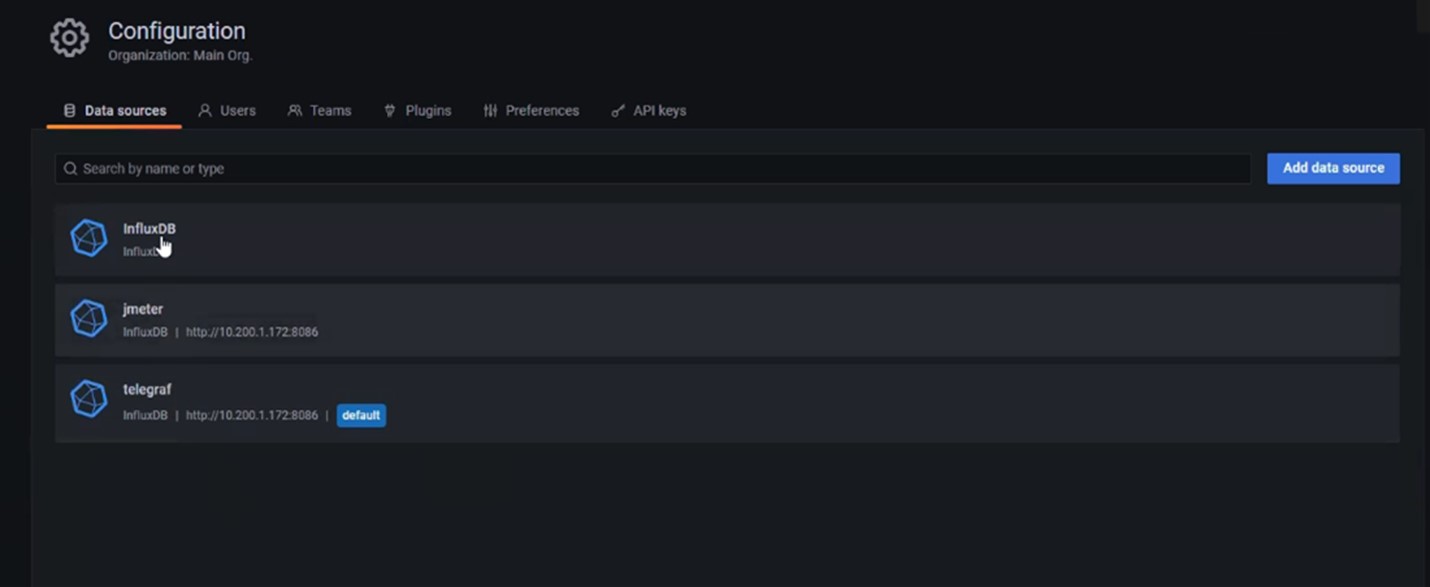
1. Go to Configuration -> Data Sources in Grafana.
2. In the opened tab, select InfluxDB among available data sources.
3. In the InfluxDB command line, which is part of the InfluxDB data source configuration in Grafana, enter use telegraf and show measurements to verify that the Telegraf database has been created in InfluxDB. The main server metrics collected by Telegraf will be displayed in a table by default.
4. Just like when configuring JMeter, enter telegraf in the Name field, and enter the server’s IP address, http://localhost:808, in the HTTP section.
5. In the InfluxDB Details section, enter the name of the telegraf database in the Database field. Then click Save. If everything is successful, you will see the message “Data source is working.”
As a result, you should have two data sources in Grafana: JMeter and Telegraf.
At this point, you can collect and store all necessary metrics in one place. The next step is to add a tool that will visualize the data and help you monitor it in real time.
Read also
A Comprehensive Guide To Performance Testing: Stages, Metrics, and Tools
Unlock the full potential of your software with effective performance testing. In this guide, we share our experience working with performance testing tools that can ensure robust software performance under high loads and large user volumes.
Step 5. Creating dashboards in Grafana
Dashboards with widgets allow for dynamic data visualization. With Grafana, JMeter performance testing can be done in real time. You can compare the results of multiple tests and analyze data over time.
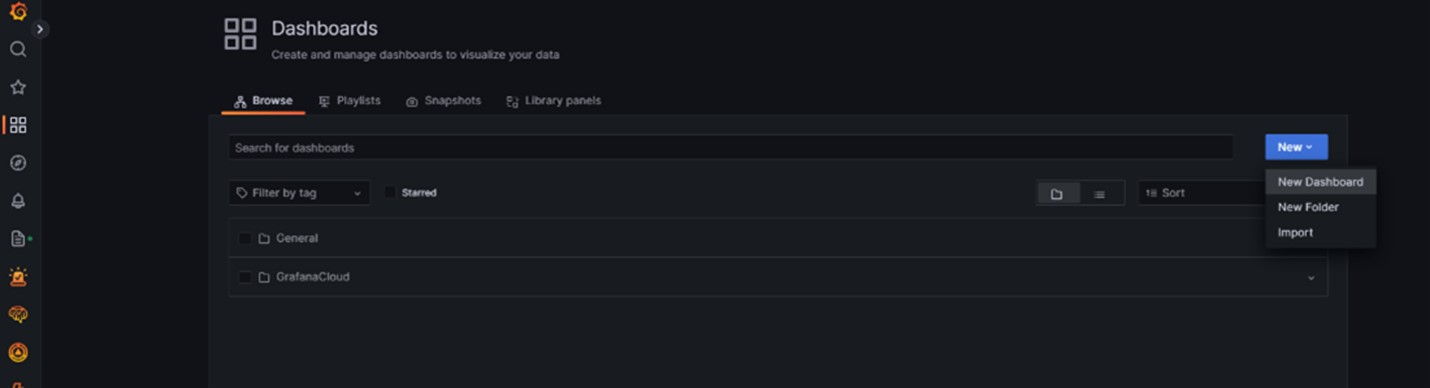
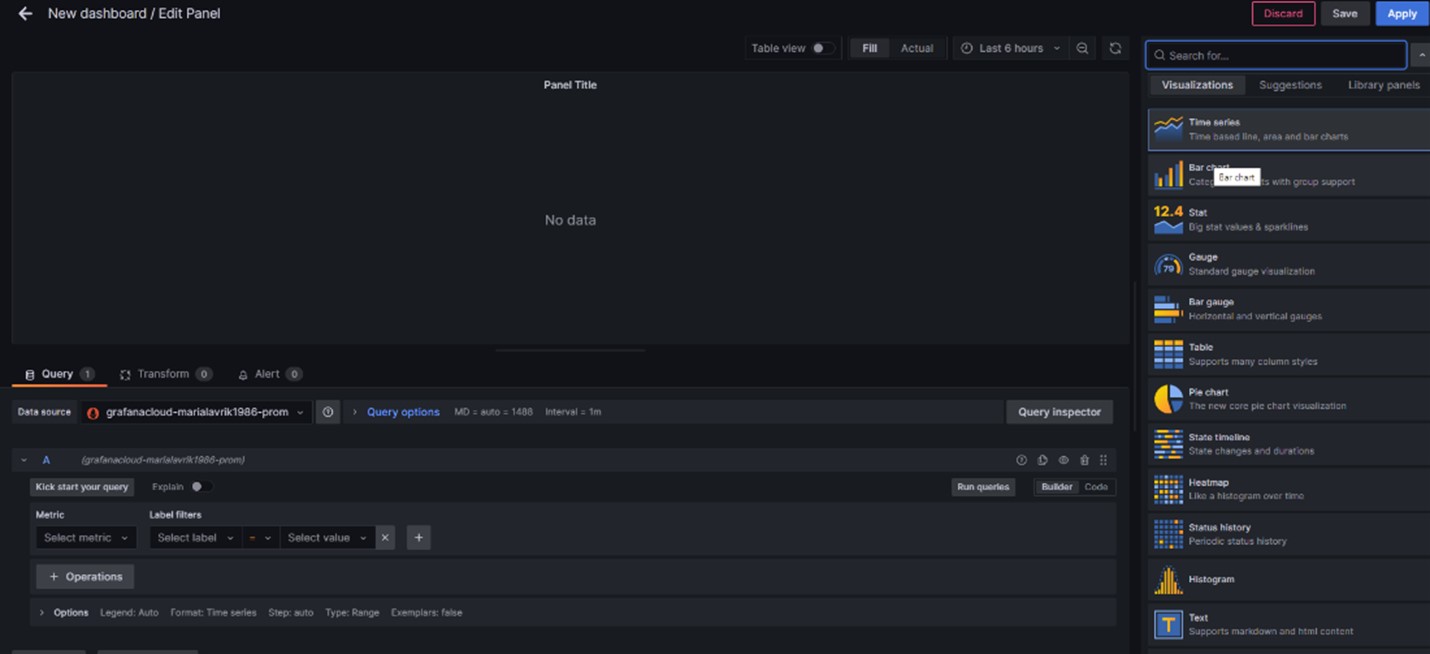
To create a dashboard, sign in to Grafana, hover over Dashboard, and select New Dashboard.
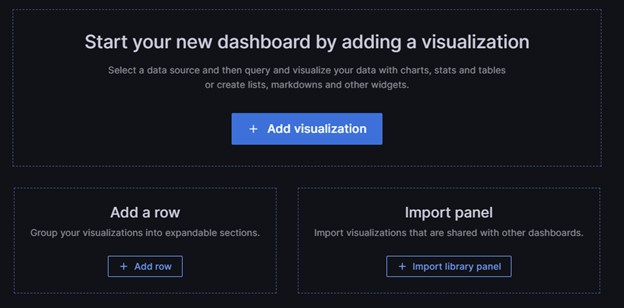
After that, choose Add a new panel.
In the first line of the Query tab, open the drop-down list and select one or several data sources. In our case, we will choose InfluxDB, Telegraf, and JMeter.
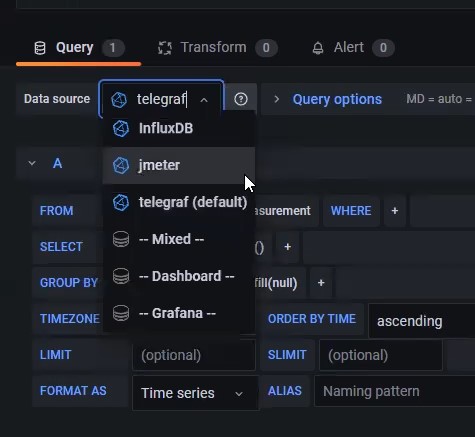
Then, write or construct a query in the query language of your data source. You can also use the query writing mode.
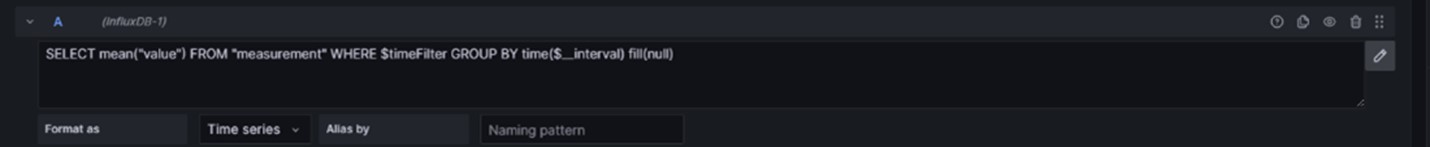
In order to navigate the database structure, you can display all values by selecting * from [db name]. In the Visualization list, select a visualization type. Grafana displays a preview of your query results with the visualization applied.
As a result, widgets displaying the specified indicators will be created in real time.
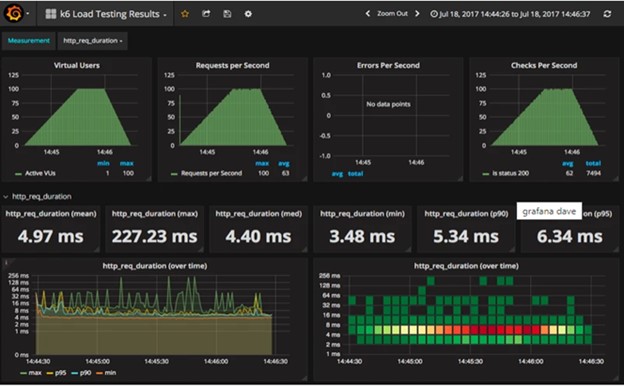
At this point, you can customize the visualization of your metrics and widgets in any way that suits your project best. This concludes the process of setting up and configuring the JMeter-Grafana-InfluxDB-Telegraf technology stack for monitoring application performance.
Conclusion
Frameworks for monitoring application performance are important tools for ensuring the quality of your web applications. You can use them to gain valuable insights into the app’s performance and make data-driven decisions that will help your product thrive. With JMeter, performance testing in conjunction with Grafana and other tools allows your QA team to get all necessary metrics for application performance and visualize them in an easy-to-analyze way.
At Apriorit, we have professional QA teams with vast experience in quality assurance and software testing who will make sure that your application works without issues. Together, we can set up a framework to optimize the performance of your new or existing app and improve the user experience in the long run.
Elevate your software quality with Apriorit!
Leverage our extensive experience in QA and software testing to boost your product’s reliability and performance.
Have a question?
Ask our expert!
VP of Engineering


