 Skip to main content
The blockchain has evolved from a fancy concept into an essential technology for lots of applications. It provides a new level of security for storing and transmitting data and funds. Using DevOps tools to implement a blockchain makes the development process faster, less painful, and more controlled.
In this article, we’ll examine blockchain infrastructure deployment and show you how to combine DevOps tools and blockchain. We’ll also deploy a private Parity Ethereum blockchain network from scratch.
This article will be useful for developers and project managers who are looking for ways to improve their blockchain development by implementing DevOps tools.
Contents:
- Why does blockchain development need DevOps?
- Create a blockchain infrastructure with Terraform
- Configuring blockchain nodes
- Orchestrate your environment with Ansible
- Ansible and AWS integration
- Configuring a basic EC2 instance with Ansible
- Deploying a blockchain node
- Monitor your environment with Prometheus & Grafana
- Preparing our environment for monitoring
- Prometheus and AWS integration
- Configuring a monitoring server
- Conclusion
Why does blockchain development need DevOps?
DevOps is a set of software development practices that combine development and operations parts of the software lifecycle. With DevOps, development and operations teams work on the software simultaneously, catering to each other’s needs. In some DevOps models, QA and security teams are also included in this process.
Blockchain technology is rapidly becoming popular beyond the financial sector. Some experts believe that by 2022, most Fortune 500 companies will be using blockchains.
DevOps improves communication between departments of a company and thus speeds up development. DevOps tools are especially important for blockchain development and writing smart contracts, as they promote fast delivery and a focus on the customer’s needs.
DevOps tools can speed up and automate deployment as well, saving time and preventing errors caused by manual coding. Also, several DevOps tools are useful for monitoring and analyzing blockchain network operations.
Let’s see how to improve blockchain development with DevOps tools:
- Terraform — Create AWS instances and manage configurations
- Ansible — Configure environments and execute scripts
- Docker — Launch blockchain nodes
- Prometheus and cAdvisor — Monitor the activity of network nodes
- Grafana — Visualize Prometheus data
Create a blockchain infrastructure with Terraform
Terraform is a tool for orchestrating cloud infrastructures that allows you to treat infrastructure as code. It supports multiple cloud providers including AWS, Google Cloud, and Heroku.
Terraform has a declarative syntax. You can use it to create, modify, and delete infrastructure elements. Terraform supports various types of data structures:
- arrays
- associative arrays
- objects
- sets (for a scalable and flexible description of the required environment)
- datasets with variable structures
Also, due to a useful display of project components, Terraform serves as a cheat sheet for new DevOps specialists.
Let’s see what advantages Terraform offers for blockchain developers. In the context of configuring AWS infrastructure manually, it helps to:
- avoid human errors during configuration of complex infrastructure
- configure processes more visually and systematically
- bring new employees up to speed on a new project
- make your infrastructure scalable and portable
Our team has vast experience working with Terraform. We’ve created infrastructures for development, testing, and production environments and have created and configured monitoring servers. Let’s use Terraform to configure blockchain nodes for our private blockchain.
Configuring blockchain nodes
We’ll start creating our infrastructure by picking an Amazon Machine Image of the operating system that will run our nodes. For our project, we’ll use Ubuntu 16.04 Server:
data "aws_ami" "ubuntu" {
  most_recent = true
  filter {
    name   = "name"
    values = ["ubuntu/images/hvm-ssd/ubuntu-xenial-16.04-amd64-server-*"]
  }
  filter {
    name   = "virtualization-type"
    values = ["hvm"]
  }
  owners = ["099720109477"]
}Now we need an aws_key_pair resource in order to add a public SSH key to our AWS host. In our case, we’ll use an aws_dev_key.pub key that was generated locally:
resource "aws_key_pair" "aws_dev_key" {
  key_name   = "dev_node"
  public_key = "${file("aws_dev_key.pub")}"
}Next, we need to set up rules for incoming and outgoing traffic. This is done with the aws_security_group resource. In our example, we allow movement of all incoming and outgoing traffic for all ports. However, you can specify only the necessary ports.
resource "aws_security_group" "allow_all" {
  name        = "allow_all"
  description = "Allow all traffic"

  ingress {
    from_port   = 0
    to_port     = 0
    protocol    = "-1"
    cidr_blocks = ["0.0.0.0/0"]
  }

  egress {
    from_port   = 0
    to_port     = 0
    protocol    = "-1"
    cidr_blocks = ["0.0.0.0/0"]
  }
}Finally, we create Elastic Compute Cloud (EC2) instances. Don’t forget to create tags, as they will be useful when working with Ansible and Prometheus.
resource "aws_instance" "dev-node" {
  count         = "${var.nodes_count}" // Declare it in variables.tf
  ami           = "${data.aws_ami.ubuntu.id}"
  instance_type = "t2.micro"
  key_name      = "${aws_key_pair.aws_dev_key.key_name}"

  security_groups = [
    "${aws_security_group.allow_all.name}",
  ]

  tags {
    Name        = "node_${count.index}"
    Environment = "dev"
  }
}

resource "aws_instance" "dev-monitoring" {
  ami           = "${data.aws_ami.ubuntu.id}"
  instance_type = "t2.micro"
  key_name      = "${aws_key_pair.aws_dev_key.key_name}"

  security_groups = [
    "${aws_security_group.allow_all.name}",
  ]

  tags {
    Name        = "monitoring"
    Environment = "dev"
  }
}Also, with the aws_eip resource we’ve selected an elastic IP for each instance:
resource "aws_eip" "node-eip" {
  count = "${var.nodes_count}"

  tags = {
    Name        = "node_${count.index}"
    Environment = "dev"
  }
}

resource "aws_eip" "monitoring-eip" {
  tags = {
    Name        = "monitoring"
    Environment = "dev"
  }
}The full source code of this configuration is stored in the demo repository.
Finally, we’ll create a simple infrastructure for our private blockchain network. Terraform helps us to optimize this process by creating all EC2 instances at once. Now, let’s configure and orchestrate them with another useful tool, Ansible.
Orchestrate your environment with Ansible
Ansible is a DevOps tool for automating configuration and deployment. During our projects, we use it to:
- deploy blockchain networks
- deploy smart contracts
- configure testing environments and testing processes
- delicately configure monitoring servers
- and more
Ansible connects with a target host (usually using SSH) and runs a lot of small scripts called modules. A group of modules and their parameters make up a playbook — an Ansible execution unit.
This tool identifies target hosts with inventory files. Such files can be static (using hard-coded IP addresses, domains, etc.) or dynamic (getting information from an API). In our example, we’ll use a dynamic inventory file.
Ansible has several advantages compared with other automation tools:
- An extensive set of modules. You can automate almost any process that you execute manually with SSH.
- Full integration with AWS. You can generate an inventory for target hosts with a simple configuration file.
- Idempotent scripts. These scripts don’t change the system after the first run. This is essential for blockchain network development.
Also, Ansible allows us to create infrastructure tests with Molecule and doesn’t require additional daemons, databases, etc.
Ansible and AWS integration
Previously, we created five EC2 instances: four for blockchain nodes and one for monitoring. Now we need to integrate them into our AWS environment.
Note that in this project, we use a basic Ansible configuration.
Our instances have the following tags:
Name: node_0, node_1, node_2, node_3, monitoring
Environment: devLet’s use them to generate a dynamic Ansible inventory:
plugin: aws_ec2
regions:
  - us-west-2
filters:
  tag:Environment: dev
keyed_groups:
  - key: tags.Name
separator: ''This configuration file tells Ansible to:
- find all EC2 instances in the us-west-2 region
- pick up instances without the
Environment: devtag - create a relevant Ansible group for each instance name
Therefore, Ansible will create five groups: node_0, node_1, node_2, node_3, and monitoring. Each group will contain only one member. This might look uncomfortable, but such a configuration is useful in our case.
Configuring a basic EC2 instance with Ansible
Our EC2 instances need several basic tools:
- Python 3
- cURL
- Doсker
- pip3
- pip3 packages: docker-compose, docker, requests
To save some time when configuring an instance, you can add these tools to a separate Ansible playbook and run it only once.
Our demo repository contains an example of such a configuration.
Deploying a blockchain node
For our project, we’ll deploy four nodes: two authority nodes and two regular nodes. Here’s a basic algorithm for deployment:
- Deploy authority nodes (node_0, node_1):
- Copy .toml config and spec.json to AWS instances.
- Start a Parity Ethereum node in Docker and create an account for each instance. The set of generated addresses forms a list of authorities.
- Copy the new spec.json file (with the list of specified authorities) and new .toml config (with specified mining information) files to AWS instances.
- Restart the Parity Ethereum node in Docker.
- Deploy regular nodes (node_2, node_3):
- Copy .toml config and spec.json (with the same authorities list) to the AWS instances.
- Start a Parity Ethereum node in Docker and create an account for each instance.
- Connect all nodes:
- Get the address of each node with the parity_enode Remote Procedure Calls (RPC) function.
- Connect the nodes to each other with the “parity_addReservedPeer” RPC function.
Blockchain node deployment scripts for our project are stored in the demo repository.
After that, our infrastructure is deployed and ready to work. Now let’s create a monitoring system in order to collect data and issue reports.
Monitor your environment with Prometheus & Grafana
We need to monitor our blockchain environment for several reasons:
- To get status updates on transaction flows
- To analyze and optimize resource use
- To gather statistics
- To get a better understanding of system operations
- And more
As we’ve mentioned, for this project we’ll use Prometheus for network monitoring and Grafana for data visualization.
Prometheus is a tool for gathering metrics from various parts of the system. Metrics are gathered by exporters — processes that listen to a target port and collect the information after the GET command. For our blockchain project, we need the following metrics:
- hardware parameters for key nodes and validators (CPU, RAM, hard drive usage, etc.)
- transaction flow and success
- balance of key nodes (can be gathered with Ethereum Exporter)
- derivatives from other metrics
All this data has corresponding timestamps. They’ll be useful in the final step of our project: working with Grafana.
Grafana is an open-source analytics tool for gathering metrics, visualizing them, and alerting on suspicious indicators. Its key advantage is integration with a lot of popular platforms and databases: Kubernetes, Google Cloud Platform, AWS, Azure Cloud, MySQL, Oracle, etc.
Preparing our environment for monitoring
Before we start working with a monitoring server, we need to create a Prometheus exporter for each network node.
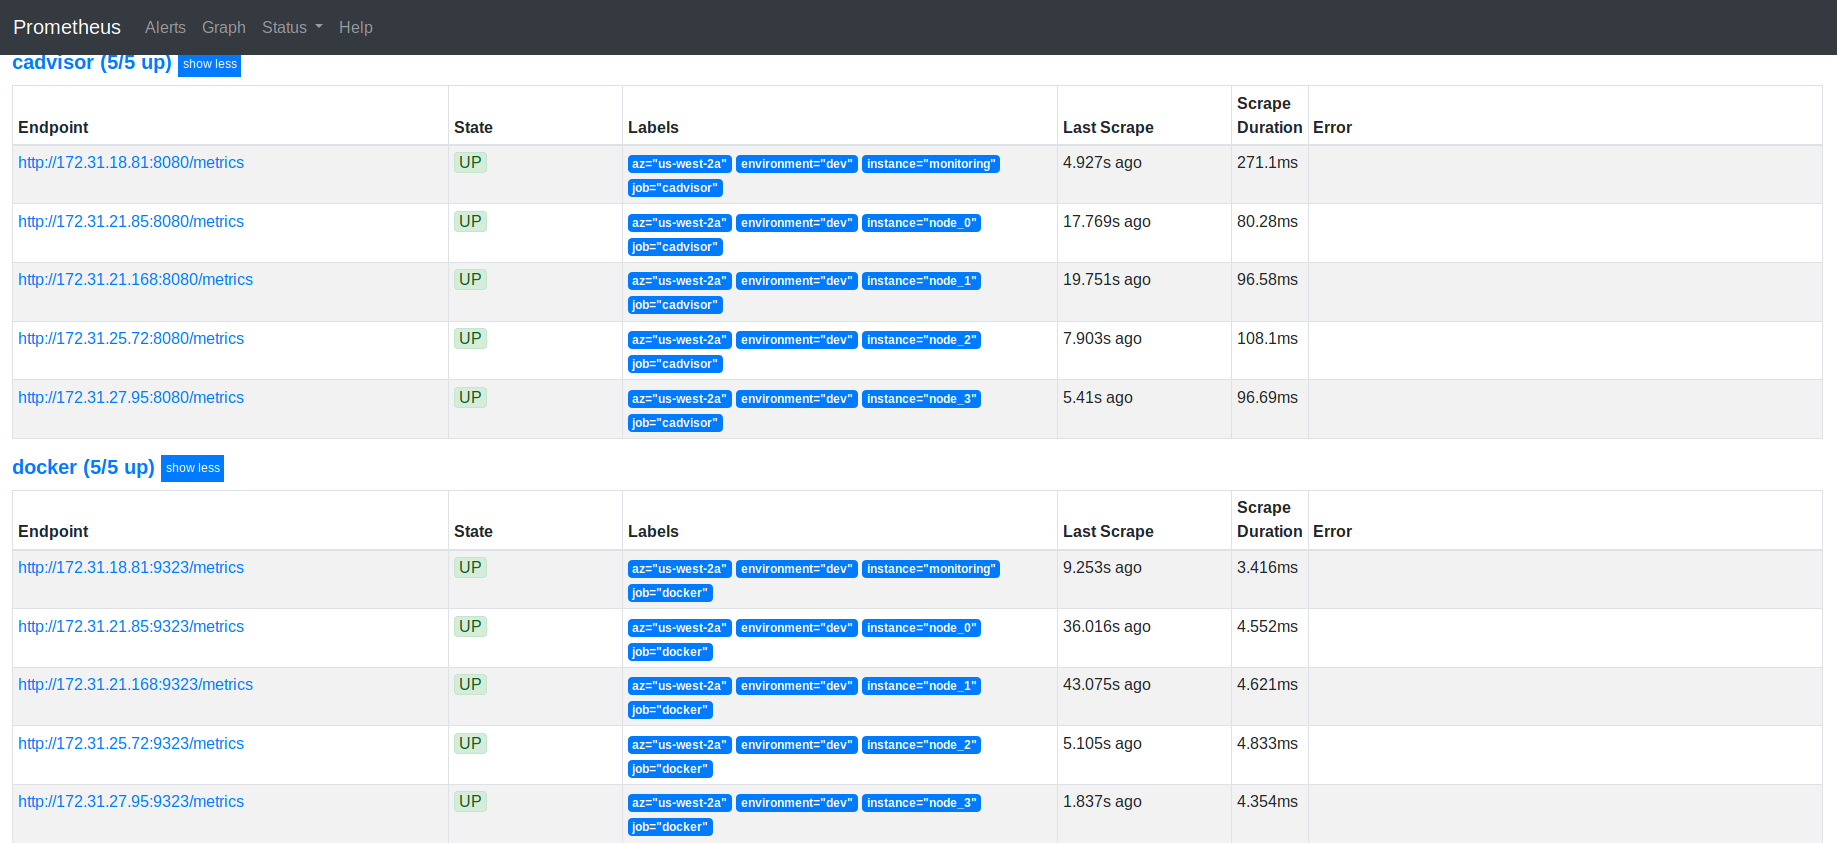
In our project, we’ll use Docker Container Exporter and cAdvisor — the most popular tools for exporting metrics. They allow us to monitor basic metrics such as CPU, RAM, and hard drive use for each container.
Docker Container Exporter is embedded into Docker, so we need to pass this configuration to Docker to activate it:
{
   "metrics-addr": "0.0.0.0:9323",
   "experimental": true,
   "log-opts": {
      "max-size": "1g" // At the same time limited the size of the logs
   }
}cAdvisor is also fast to install. We need to pull the Docker image to the AWS host and run a container with a simple configuration.
You can find scripts for this in the demo repository (base_setup.yml and install_cadvisor.yml).
Prometheus and AWS integration
We’ll integrate Prometheus and AWS with this integration file:
---
global:
  evaluation_interval: 30s

scrape_configs:
 - job_name: docker
   ec2_sd_configs:
    - region: us-west-2
      port: 9323
   relabel_configs: &ec2_relabel_configs
     - target_label: instance
       regex: '(.+)'
       source_labels: [__meta_ec2_tag_Name]
     - target_label: environment
       regex: '(.+)'
       source_labels: [__meta_ec2_tag_Environment]
     - target_label: az
       regex: '(.+)'
       source_labels: [__meta_ec2_availability_zone]

 - job_name: cadvisor
   ec2_sd_configs:
    - region: us-west-2
      port: 8080
relabel_configs: *ec2_relabel_configsAccording to this configuration, Prometheus will request all EC2 instances from the us-west-2 region via port 9323 (which runs the Docker Container Exporter) and port 8080 (which runs cAdvisor).
Also, Prometheus will change some data fields in the metrics using instance metadata. Our configuration file will make those fields more user-friendly. For example, it will change “__meta_ec2_tag_Name” to “instance”.
In order to ensure Prometheus has access to AWS, we’ll assign two environment variables on container start: AWS_ACCESS_KEY_ID and AWS_SECRET_ACCESS_KEY.
Configuring a monitoring server
Note: In this article, we skip the process of protecting sensitive ports with authentication.
We’ve already created a monitoring server during Terraform deployment. Now, let’s configure it in order to use the information it collects in the best possible way. We’ll do this by deploying Prometheus and Grafana. Prometheus can be deployed in three steps:
- Create a configuration folder structure for further structure virtualization in Docker.
- Copy a configuration file (mandatory) and rule files (optional).
- Run the container.
After that, we can address the 9090 port of our monitoring host in order to see a list of targets that were found by Prometheus:
After we’ve set up Prometheus, let’s deploy Grafana. The algorithm is the same. The only exception is that Grafana allows for creating a Prometheus data source when launching the container. It looks like this:
---
apiVersion: 1

datasources:
  - name: Prometheus
    type: prometheus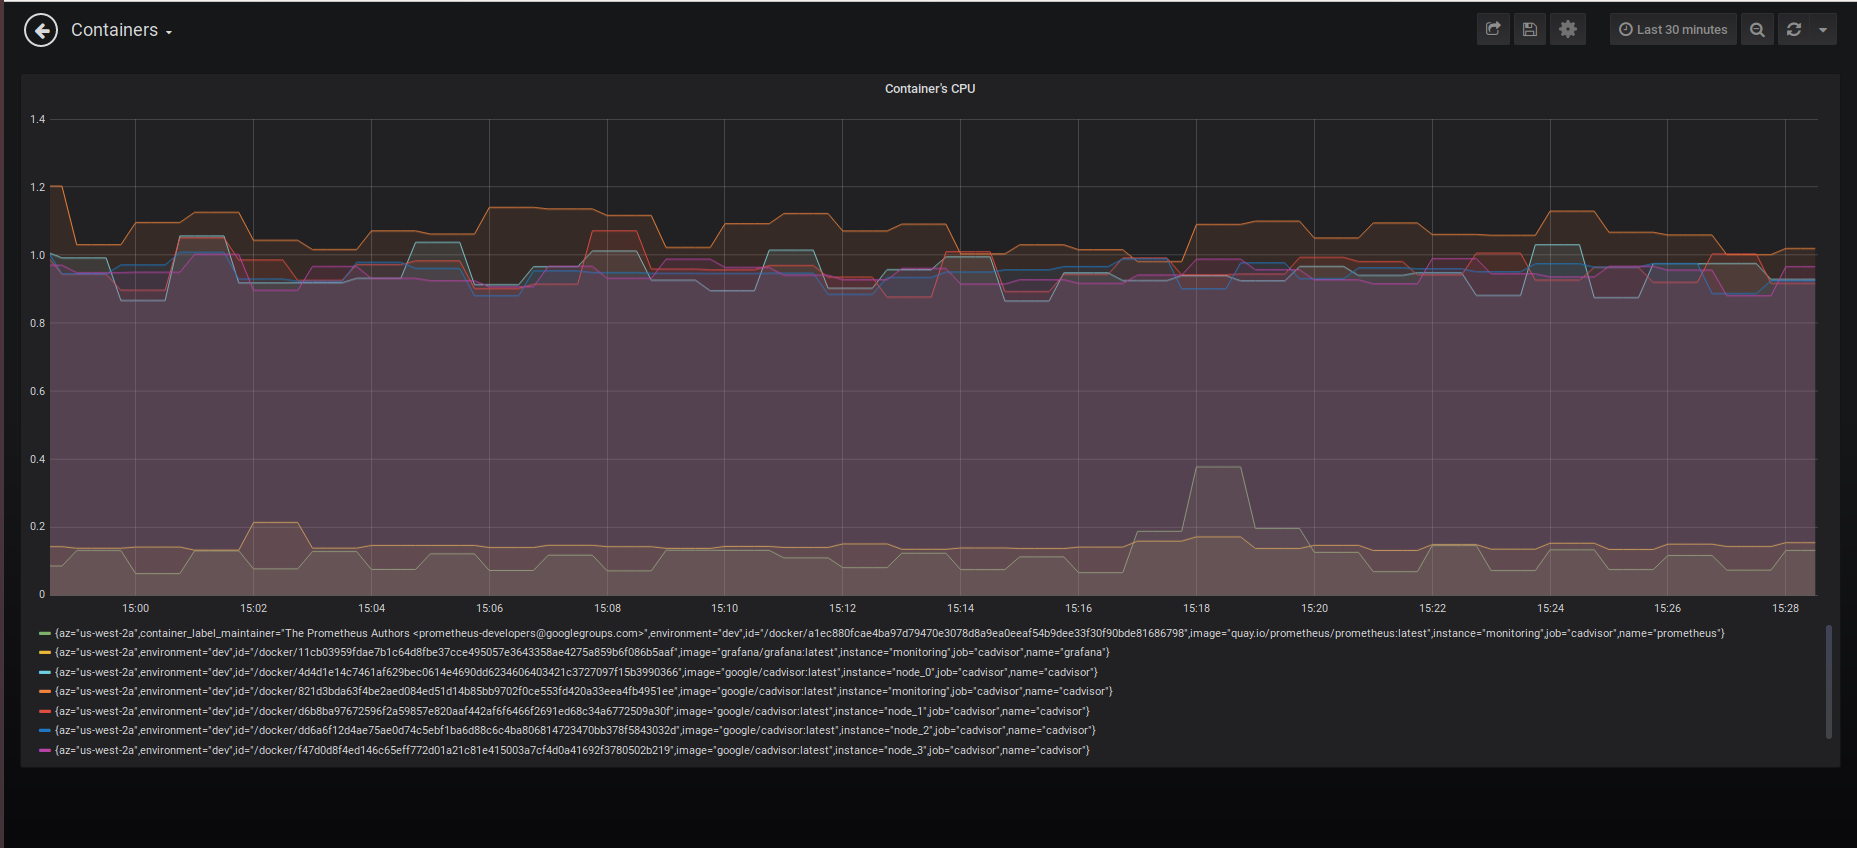
url: http://prometheus:9090We can check if these tools work correctly by calculating CPU usage in monitoring containers. This can be achieved by creating a Grafana panel with the following query:
avg without(cpu) (rate(container_cpu_usage_seconds_total{image=~"(.*prometheus.*|.*grafana.*|.*cadvisor.*)"}[2m]))*100
This command shows us the CPU usage in blockchain nodes:
avg without(cpu) (rate(container_cpu_usage_seconds_total{image=~"(.*parity.*)"}[2m]))*100
The screenshot below shows the results for both commands. Note that Grafana provides a graphical interpretation below the graph.
You can find detailed scripts of this deployment in the demo repository (monitoring.yml).
Conclusion
It’s impossible to underestimate the significance of DevOps for blockchain. Configuring the environment for a blockchain network requires a lot of responsibility and mindfulness and a vast knowledge base.
Ansible and Terraform allow us to automate blockchain network deployment processes and thus:
- save time during development, testing, and support
- eliminate the risk of human errors
DevOps tools for monitoring provide us with complete records on the system’s state at any given moment. Prometheus collects all the metrics you need and alerts you when issues occur with APIs. And all collected data can easily be visualized with the help of Grafana.
At Apriorit, we’re passionate about enhancing blockchain solutions with new development approaches. In addition to an Agile- or Scrum-based delivery process, we implement DevOps tools for better automation and resource monitoring.
We have vast development experience and can build and test a blockchain-based solution of any complexity. Want to challenge us with your project? Contact us to start discussing it!
Have a question?
Ask our expert!
VP of Engineering


