 Skip to main content
This article is about the features of debug of applications emulated by the WOW64 subsystem. Supposed, that the reader is acquainted with the debugger windbg principles.
1. Porting of many software products, which are developed for 32-bit versions of NT OS family, is currently necessary. It is good, when the product doesn’t contain any platform depending parts. In this case, the porting is successful. But in some cases, application porting to other platform takes much time or the platform versions are not available for some components and libraries, which were used for development. For these cases, Microsoft created the WOW64 subsystem, which is included in the 64-bit OS versions. 32-bit applications can be performed in 64-bit OS without the initial executables modification, because WOW64 emulates the 32-bit environment.
No matter how good WOW64 is but sometimes developers find out that some system APIs, which are called from the emulated applications, don’t work correctly. Debugging and setting breakpoints don’t work correctly in some cases. What are the reasons of this behavior?
2. One of the main things that a developer must understand is: system API calls for the emulated application are translated through one or several dll-s of the WOW64 subsystem. It means that the call begins in 32-bit system with 4 Gb address space and 4-bit pointers. Then it jumps to 64-bit environment, executes there, and result is returned back to 32-bit environment. If the results contain platform depending data, for example, pointers, then scarcely obvious error code or partially/fully not valid data will be the result of the call.
The GetModuleFileNameEx function call is a good example. Let’s suppose that we want to know a 64 bit process name. And when the GetModuleFileNameEx function is called from the emulated application with the following parameters: hProcess = Handle to the process we are interested in, hModule = null; we get such error code ERROR_PARTIAL_COPY.
Why do we get such error code? The matter is that, the GetModuleFileNameEx function requires the PEB access. For this case, NtQueryInformationProcess with the PROCESS_BASIC_INFORMATION parameter is called for getting a PEB pointed structure.
typedef struct _PROCESS_BASIC_INFORMATION {
    LONG  ExitStatus;
    PVOID  PebBaseAddress;
    LONG  AffinityMask;
    LONG  BasePriority;
    ULONG  UniqueProcessId;
    ULONG  InheritedFromUniqueProcessId;
} PROCESS_BASIC_INFORMATION, *PPROCESS_BASIC_INFORMATION;As a result, the NtQueryInformationProcess call jumps from 32-bit stub to the 64-bit native, works, gets 64-bit structure as a result, and then WOW64 fills 32-bit result structure.
But the structure received a result of the native service work differs in size from the structure required by the emulated application. It’s because this structure includes pointers and their size is notably different for different platforms. It is 4 bytes for 32-bit environment and it is 8 bytes for 64-bit environment. So, result size of 64-bit structure is greater than result size of 32-bit structure. And so we get the following questions:
How can 64-bit pointer be put in 32 bites without losses?
How does WOW64 act?
Simply, it fills such problem sections as member-pointers in 32-bit structure with zeros and returns STATUS_SUCCESS. Thereafter, GetModuleFileNameEx calls ReadProcessMemory with the PEB address parameter, which is obtained from the preceding structure. But this parameter is null now. That’s why ReadProcessMemory returns the ERROR_PARTIAL_COPY error code.
3. When you develop your drivers with the WOW64 support, it will be better for you to follow such rule: don’t use such data types:
- pointers;
- size_t;
DWORD_PTR, INT_PTR, LONG_PTR, UINT_PTR, ULONG_PTR;
in the application interaction protocol.
All these types are compiled to the 32-bit ones in i386 and to the 64-bit ones in the AMD64 configuration.
I.e. if you send such structure to the driver:
typedef struct OldRequest
{
    size_t a, b, c;
}OldRequest_type;…you should replace it by:
typedef struct OldRequest_amd64
{
    ULONGLONG a, b, c;
}OldRequest_amd64_type;If you cannot change the communication protocol, you can use the undocumented driver function PsGetCurrentProcessWow64Process (at your peril, of course) to define the properties of application that made request
PVOID PsGetCurrentProcessWow64Process(VOID);this way:
if  (PsGetCurrentProcessWow64Process())
{
   //  the current process context is under wow64 subsystem
}Here is the example – the test driver that returns the sum c = a + b in the structure:
NTSTATUS DoTest(IN PDEVICE_OBJECT  DeviceObject,
                IN PVOID pBuffer,
                IN ULONG sizeIn,
                IN ULONG maxBufferSize,
                OUT ULONG * pSizeOut)
{
    DevExt_type * pDevExt=
        (DevExt_type*)DeviceObject->DeviceExtension;
    *pSizeOut = 0;
#if defined (_M_AMD64)
    // only for AMD64 builds
    if (pDevExt->pPsGetCurrentProcessWow64Process())
    {
        // user is under WOW
        if (sizeIn < sizeof(OldRequest_i386_type))
            return STATUS_BUFFER_OVERFLOW;
        if (maxBufferSize < sizeof(OldRequest_i386_type))
            return STATUS_BUFFER_OVERFLOW;
        {
            OldRequest_i386_type * p = (OldRequest_i386_type *)pBuffer;
            p->c = p->a + p->b;
        }
        *pSizeOut = sizeof(OldRequest_i386_type);
        return STATUS_SUCCESS;
    }
#endif
    // user is true amd64 guy
    if (sizeIn < sizeof(OldRequest_amd64_type))
        return STATUS_BUFFER_OVERFLOW;
    if (maxBufferSize < sizeof(OldRequest_amd64_type))
        return STATUS_BUFFER_OVERFLOW;
    {
        OldRequest_amd64_type * p = (OldRequest_amd64_type *)pBuffer;
        p->c = p->a + p->b;
    }
    *pSizeOut = sizeof(OldRequest_amd64_type);
    return STATUS_SUCCESS;
}The OldRequest_i386_type is defined this way:
typedef struct OldRequest_i386
{
    ULONG a, b, c;
}OldRequest_i386_type;To install the test driver use the bat file install_test.bat with the path parameter defining the the location of the built sys file. To run the test, use start_test.bat with two parameters defining the summands.
The driver sample is in the archive attached to this article.
4. Sooner or later we need to fix the emulated application. This can be performed locally or remotely, with different tools, for example, using Visual Studio or windbg.
I will show below how to browse stacks of calls of all process treads and how to set breakpoints during the remote debug using the latest windbg version.
1) First, you should be sure that the downloaded extension WOW64exts for windbg, which will help us with remote debug, is available. In the latest versions of windbg it should be included by default.
If the extension is not present, it is necessary to setup it manually and download it using the command
load wow64exts.
0: kd> .chain
Extension DLL search Path: …
    Extension DLL chain:
***
C:\Program Files\Debugging Tools for Windows (x86)\WINXP\wow64exts: image 6.1.7650.0, API 1.0.0, built Mon Feb 01 22:08:04 2010[path: C:\Program Files\Debugging Tools for Windows (x86)\WINXP\wow64exts.dll]
***
2) Thereafter, we should find the process, which we are interested in. For example, TestUserApp.exe
0: kd> !process 0 0
**** NT ACTIVE PROCESS DUMP ****
PROCESS fffffa8006d03b30
    SessionId: none  Cid: 0004    Peb: 00000000  ParentCid: 0000
    DirBase: 00187000  ObjectTable: fffff8a0000018c0  HandleCount: 555.
    Image: System
PROCESS fffffa8007e31b30
    SessionId: none  Cid: 00d4    Peb: 7fffffd9000  ParentCid: 0004
    DirBase: 1a271000  ObjectTable: fffff8a000457a20  HandleCount:  30.
    Image: smss.exe
PROCESS fffffa8008afeb30
    SessionId: 0  Cid: 0138    Peb: 7fffffdb000  ParentCid: 0130
    DirBase: 12d55000  ObjectTable: fffff8a002d70d20  HandleCount: 381.
    Image: csrss.exe
***
PROCESS fffffa8006dd6060
    SessionId: 1  Cid: 0bb4    Peb: 7efdf000  ParentCid: 06e0
    DirBase: 063d8000  ObjectTable: fffff8a000c6c8a0  HandleCount:  16.
Image: TestUserApp.exe3) Switch to the context of this process.
0: kd> .process /i fffffa8006dd6060
You need to continue execution (press 'g' <enter>) to switch the context. When the debugger breaks in again, you will be in
the new process context.
0: kd> g
Break instruction exception - code 80000003 (first chance)
nt!DbgBreakPointWithStatus:
fffff800`0287af60 cc 4) Download the symbols for this process.
0: kd> .reload /i testuserapp.exe
*** WARNING: Unable to verify checksum for TestUserApp.exe 5) Make sure that the symbols are actually loaded:
0: kd> lmsm
start             end                 module name
fffff880`00fa4000 fffff880`00ffb000   ACPI       (deferred)
fffff880`02c42000 fffff880`02ccc000   afd        (deferred)
fffff880`02dd4000 fffff880`02dea000   AgileVpn   (deferred)
***
00000000`01010000 00000000`01034000   TestUserApp C (private pdb symbols)
d:\development\projects\testuserapp\debug\TestUserApp.pdb6) See details for our process, namely its threads. So far, only 64-bit stacks of threads are available.
0: kd> !process fffffa8006dd6060
PROCESS fffffa8006dd6060
    SessionId: 1  Cid: 0bb4    Peb: 7efdf000  ParentCid: 06e0
    DirBase: 063d8000  ObjectTable: fffff8a000c6c8a0  HandleCount:  16.
    Image: TestUserApp.exe
    VadRoot fffffa8006e29e20 Vads 40 Clone 0 Private 155. Modified 0. Locked 0.
    DeviceMap fffff8a000d6bfc0
    Token                             fffff8a000fb5a90
    ElapsedTime                       00:00:09.828
    UserTime                          00:00:00.000
    KernelTime                        00:00:00.000
    QuotaPoolUsage[PagedPool]         0
    QuotaPoolUsage[NonPagedPool]      0
    Working Set Sizes (now,min,max)  (680, 50, 345) (2720KB, 200KB, 1380KB)
    PeakWorkingSetSize                680
    VirtualSize                       16 Mb
    PeakVirtualSize                   16 Mb
    PageFaultCount                    701
    MemoryPriority                    BACKGROUND
    BasePriority                      8
    CommitCharge                      212
    Job                               fffffa8009214ce0
        THREAD fffffa8006e9f450  Cid 0bb4.055c  Teb: 000000007efdb000 Win32Thread: 0000000000000000 WAIT: (DelayExecution) UserMode Non-Alertable
            fffff8800226ba78  NotificationEvent
        Not impersonating
        DeviceMap                 fffff8a000d6bfc0
        Owning Process            fffffa8006dd6060       Image:         TestUserApp.exe
        Attached Process          N/A            Image:         N/A
        Wait Start TickCount      943059         Ticks: 36 (0:00:00:00.562)
        Context Switch Count      34
        UserTime                  00:00:00.078
        KernelTime                00:00:00.015
        Win32 Start Address TestUserApp!ILT+320(_wmainCRTStartup) (0x0000000001021145)
        Stack Init fffff8800226bdb0 Current fffff8800226b970
        Base fffff8800226c000 Limit fffff88002266000 Call 0
        Priority 11 BasePriority 8 UnusualBoost 0 ForegroundBoost 2 IoPriority 2 PagePriority 5
        Child-SP          RetAddr           Call Site
        fffff880`0226b9b0 fffff800`0288a052 nt!KiSwapContext+0x7a
        fffff880`0226baf0 fffff800`0288c756 nt!KiCommitThreadWait+0x1d2
        fffff880`0226bb80 fffff800`02b7a9ee nt!KeDelayExecutionThread+0x186
        fffff880`0226bbf0 fffff800`02882153 nt!NtDelayExecution+0x59
        fffff880`0226bc20 00000000`75692dd9 nt!KiSystemServiceCopyEnd+0x13 (TrapFrame @ fffff880`0226bc20)
        00000000`0025e438 00000000`75692c87 0x75692dd9
        00000000`0025e440 00000000`77d00190 0x75692c87
        00000000`0025e448 00000000`75700023 0x77d00190
        00000000`0025e450 00000000`001d8fe0 0x75700023
        00000000`0025e458 00000000`0044fc30 0x1d8fe0
        00000000`0025e460 00000000`0000002b 0x44fc30
        00000000`0025e468 00000000`7efdf000 0x2b
00000000`0025e470 00000000`00000000 0x7efdf0007) Switch to the context of thread, which we are interested in.
0: kd> .thread /w fffffa8006e9f450
Implicit thread is now fffffa80`06e9f450
The context is partially valid. Only x86 user-mode context is available.
x86 context set8) Reload the symbols
0: kd:x86> .reload
Connected to Windows 7 7600 x64 target at (Fri Apr 15 19:36:19.106 2011 (UTC + 3:00)), ptr64 TRUE
Loading Kernel Symbols
...............................................................
................................................................
...................
Loading User Symbols
.....
Loading unloaded module list
.....Unable to enumerate user-mode unloaded modules, Win32 error 0n30
Loading Wow64 Symbols
............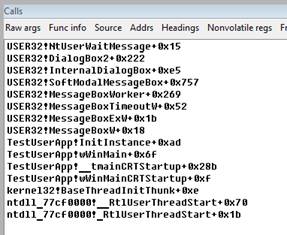
*** WARNING: Unable to verify checksum for TestUserApp.exe9) Now, 32-bit stack of the thread is available in the Calls window. As we can see in the stack, our test application (its current thread, to which context we switched) displays the modal dialog window and is waiting for the user reaction.
10) Since we are already in the context of the corresponding process and thread, we can set the breakpoint at some function. If we don’t remember the function full name, we can start search by the pattern or by the part of its name. In the search results we will see all the symbol hits and the corresponding start addresses.
0: kd:x86> x testuserapp!*foo*
00000000`01022130 TestUserApp!foo (void)11) And so, now we can set the breakpoint, close the modal dialog window that will continue the program execution. And now, we can enjoy the fired trap.
0: kd:x86> bp testuserapp!foo
0: kd:x86> g
Break instruction exception – code 80000003 (first chance)To debug an application locally using Visual Studio, we should attach to this application using the ctrl + alt + p combination. After that, we can suspend threads and set breakpoints. It is necessary to install Visual Studio Remote Debugger Monitor on the PC, on which the target application is running.
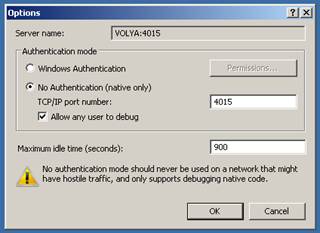
Important note: It is necessary to install 32-bit version of Remote Debugger Monitor. After installation, at the first start, you should configure Remote Debugger Monitor. To do this, you should open the Preferences window by selecting Tools-> Options, and select the settings as shown below.
After this we can attach to the remote PC by its address, , using the same ctrl + alt + p combination, choose the corresponding process from the running process list, attach to it and fix it.
I hope, this information will help you to debug your programs quickly and easily.
How to Build
Build steps :
- Install Windows Driver Developer Kit 2003 – http://www.microsoft.com/whdc/devtools/ddk/default.mspx
- Set global environment variable “BASEDIR” to the path of installed DDK. Go here: Computer -> Properties -> Advanced -> Environment variables ->System Variables -> New
- And set it like this: BASEDIR -> c:\winddk\3790
- (You have to restart your computer after this.)
Have a question?
Ask our expert!
VP of Engineering


