 Skip to main content

Program optimization, and in particular code and algorithm optimization, are very important tasks for different kinds of systems: extended client-server applications, heavy-data processors, network monitoring tools, etc. This article is a short introductory Intel Vtune tutorial, covering how to use – an application performance analysis tool that can help with these tasks. This tutorial is mainly for people, who just start their work with this tool. In this article, we show an example of the usage of the program.
Contents:
1. Intel VTune Amplifier Main Features
You can download a trial version (for 30 days usage) on the official website. You can also purchase the full version there.
In this VTune amplifier tutorial, we examine only Algorithm Analysis intended for the analysys of an application work on the algorhithm level. However VTune offers a number of possibilities for the Advanced Hardware-level Analysis. There is also the power efficiency analysis.
You can find more details on the Intel official website .
2. Usage Example
Hotspots
This type of analysis is intended to identify the most labor-intensive parts of the source code.
Let’s have a look at the following example:
There was an issue with a file server that caused a rapid data transfer speed slowdown during the upload of a big file to the server. We used the Hotspots analysis to find the cause for this behavior.
We won’t describe all the preparatory stages necessary for the project under the research, as they are well described in the Intel VTune amplifier tutorial here.
We received the following results after launching the server via the built-in Hotspots analyzer:
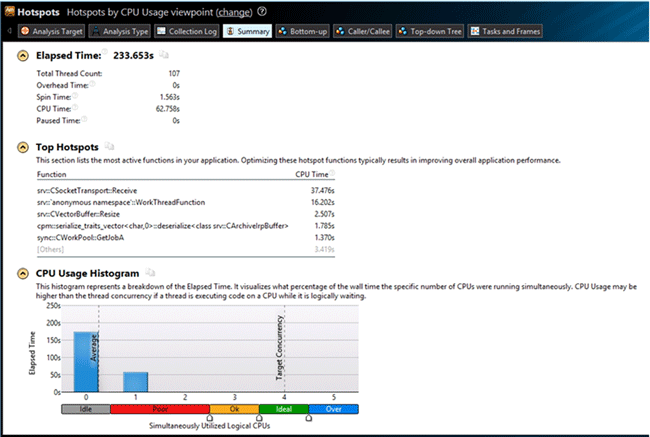
The results clearly show that the time is mostly consumed by the srv::CSocketTransport::Receive functions: 37.467 seconds.
On the Tasks and Frames tab we can see the thread distribution of the CPU load:
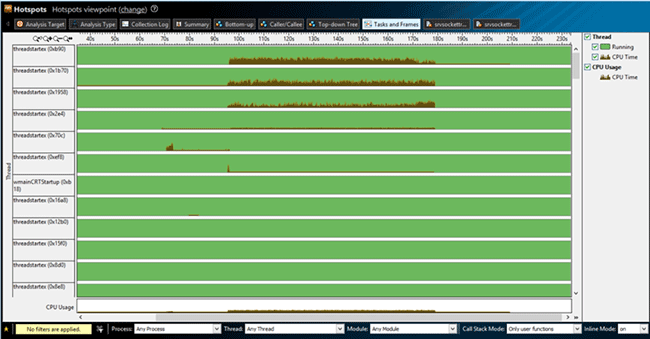
The diagram clearly shows that the CPU load was mostly caused by the first tree threads. VTune allows filtering the required thread for its detailed examination. For this purpose, we need to select the required thread below, in the Thread window. We examine threadstartex (0xb90) in our case. Software also allows filtering the required part of the graph and provides the information on the stack in this part of the graph. To do this, we need to select the required part of the graph and click Filter In by Selection or Zoom In and Filter In by Selection. Thus only this part is displayed in the graph.
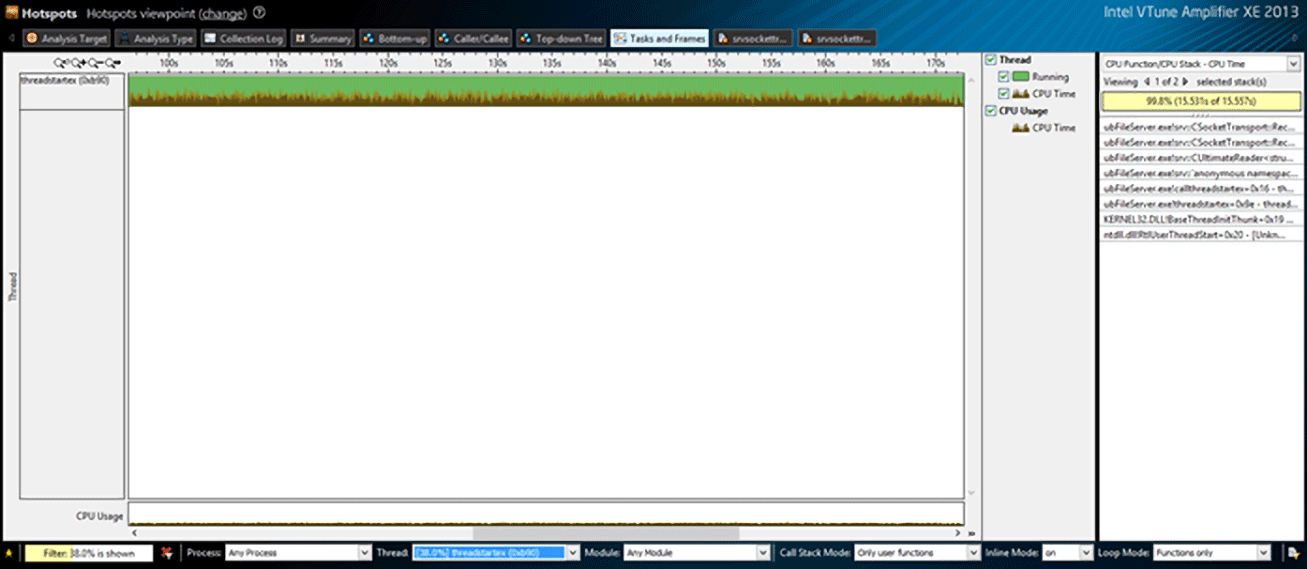
The stack for this part is shown to the right of the graph. Let’s look at the stack beginning with its top – ubFileServer.exe!srv::CSocketTransport::Receive.
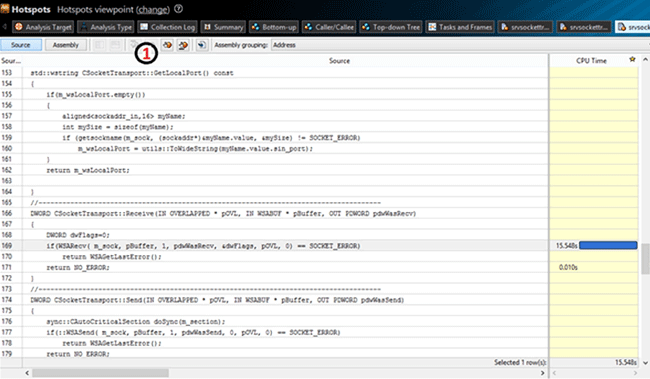
By default, VTune displays the part of the code whose execution consumes the most time. There is a navigation panel (marked with 1 on the image above), which is used to display the next “tight place”. In our case, it is consumed while waiting for the response from the client, by the WSARecv function. Thus we can make a conclusion that the problem is on the client side.
For the client side analysis, we use remote analysis tools provided by VTune. First we need to create an installation package for a remote computer. Here is the corresponding command line:
VTune_Amplifier_XE_2013_setup.exe --extract-only –silent --extract-folder E:testVTune_Amplifier_XE_2013_unpacked
If no folder is specified, the package is saved to the following path:
<Instalation folder>IntelDownloadVTune_Amplifier_XE_2013_unpacked
Then we need to copy the folder VTune_Amplifier_XE_2013_unpacked to the remote computer and launch VTune_Amplifier_XE_2013_unpackedInstallsps_he_cliAmplifier_XE.msi. After that, we need to launch VTune_Amplifier_XE_2013_unpackedInstallsmsvcrt_x86.msi or msvcrt_x64.msi depending on the system.
To see an example of an analysis launching from the command line, select the required analysis type on the local machine, Hotspots in our case, and click the CommandLine button in the bottom right. A dialog window opens. It contains the command for launching this type of analysis with the current settings. You can have a look at the ccommand line interface following this link.
In our case we need to enter the following line:
“C:Program FilesIntelAmplifier XE  2013bin32”amplxe-cl –collect hotspots--search-dir sym=“C:Program  FilesClient”--search-dir
 sym=srv*C:Windowssymbols*http://msdl.microsoft.com/download/symbols -result-dir  C:Temp “C:Program FilesClientClient.exe”
Then we need to copy the result generated on the remote machine to the local machine and then analyze it on the local machine.
We received such results:
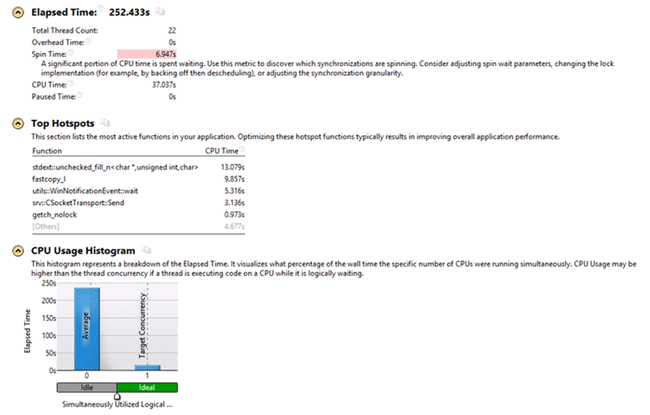
The received results show that the CPU time is mostly consumed by the stdext::unchecked_fill_n<char*, unsignedint, char> function: 13,079 out of 37,037 seconds. To examine the function in details, open the Bottom-up tab, where the list of the most capacious functions is displayed.
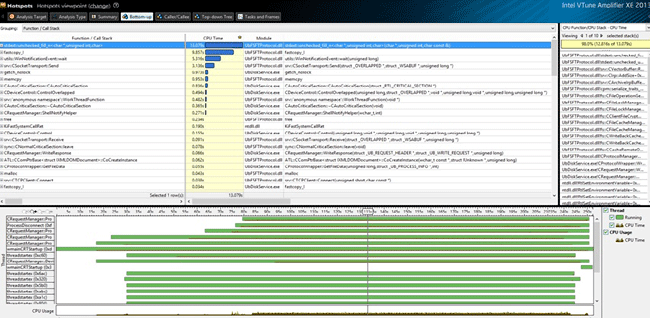
Looking at the stack, we can see that the time is mostly consumed by the operation that changes the buffer size for the package being sent:
void Resize(DWORD dwSize)
    {
        if(dwSize > GetSize())
        {
            if( 0 != dwSize % g_iIrpAllocationGranularityInBytes)
                dwSize += (g_iIrpAllocationGranularityInBytes - dwSize % g_iIrpAllocationGranularityInBytes);
            if(dwSize > MAX_PACKAGE_SIZE)
                throw std::runtime_error("Package size more max.");
            m_buffer.resize(dwSize);    - estimate 12,816 sec
        }
}After checking the functions down the stack we found out that a part of the logic didn’t work as expected. While a big file is being written, if its parts do not follow each other in sequence, then according to the application logic, the whole cache is discarded, i.e. it is sent to the client. But in our case, it appeared that almost all parts did not follow each other in sequence, and the cache size was 8MB. Because of this, on each attempt of the system to write 64KB, the client was sending 8MB. And the time was mostly consumed by the allocation of the buffer, which became clear from the results of the VTune analysis.
Thus, with the help of the Hotspots analysis, we were able to localize an error in the logic of our application.
Lightweight Hotspots
This type of analysis is the most effective for the analysis of the code with a great number of small but frequently called functions. Unlike the Hotspots analysis, it is less resource-consuming. The load reduction allows setting the lower selection interval less than with the Hotspots analysis (1 ms, for example).
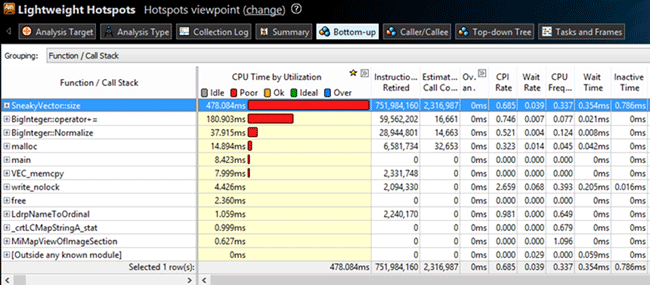
We will use this type of analysis on a small test application. This application calculates the Nth Fibonacci number. But it was slightly altered for test purposes. The SneakyVector container, which doesn’t store its own size but recalculates all the elements, was added. We received the following results after making all the preparatory operations and launching the Lightweight Hotspots analysis for the application:
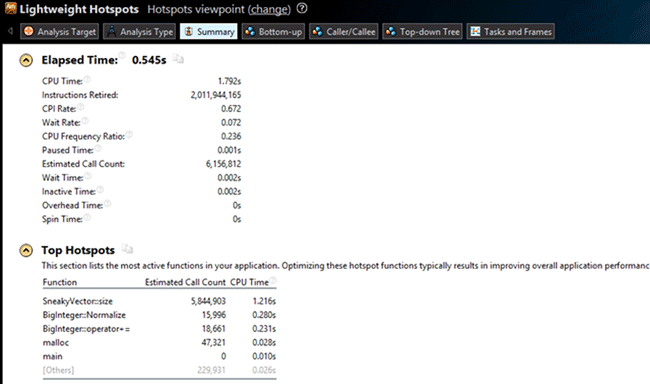
We can see that VTune found the modification easily. But there is one more frequently called function: the BigInteger::Normalize class method.
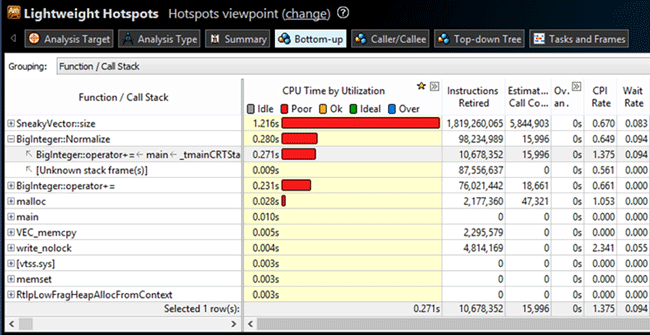
After examining the code of this method we can conclude that the most time is consumed by the
{code}for (int i = 0; i<_nums.size(); ++i) cycle: 156,42 ms.{/code}
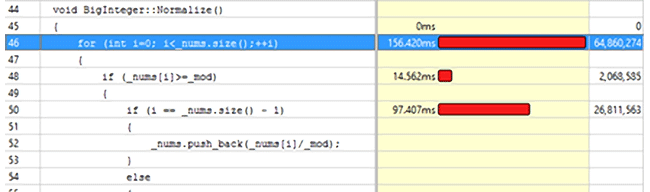
The situation can be fixed by changing the code in such a way that _nums.size() is called only once. Like this, for example:
int iSize = _nums.size();
for (int i = 0; i < iSize; ++i)We received the following results after recompiling the project and launching the Lightweight Hotspots analysis:
The results clearly show that the BigInteger::Normalize method execution time become almost three times less. But in orded to get the exact information on the difference in the execution time, we will use the VTune integrated result comparison tool. To do this, click the ![]() icon on the VTune pane or select results in the project tree and click the same   icon in the right-click menu.
icon on the VTune pane or select results in the project tree and click the same   icon in the right-click menu.
We received the following results:
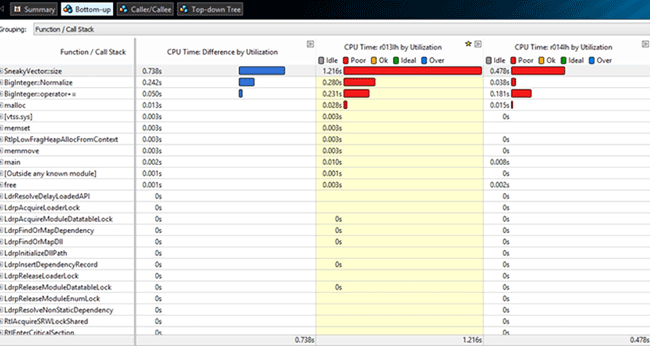
I.e. the BigInteger::Normalize execution time became 0,242 s shorter.
Concurrency Analysis
This type of analysis shows how the application uses the available logical processors and allows finding the potential candidates for parallelization.
As an example, we used an application that creates a certain number of files with a set size in a folder. This type of analysis is launched just as the previous ones, so will get right to the VTune results:
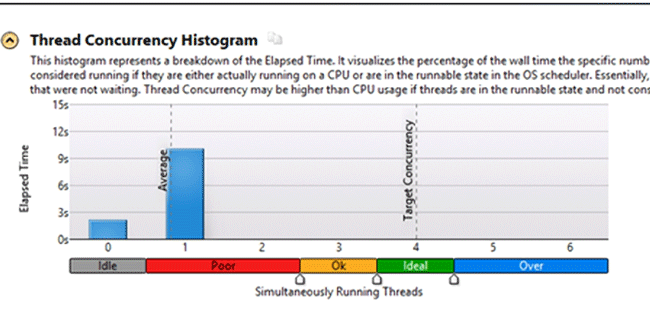
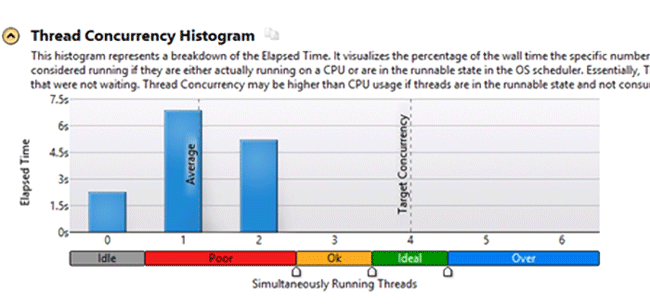
VTune distributes the CPU load according to the following modes:
– Idle – all the processors are in the standby mode, no process is executed.
– Poor – the number of simultaneously busy processors is less than 50%.
– Ok – the load of all processors is 51-85%
– Ideal – the load of all processors 86 -100%
– Over – the processors are overloaded.
The overall results show that the application works ineffectively. To improve the processors load we add another thread to the application. After launching the analysis one more time, we received the following results:
We can see that the application uses the available resources more effectively after the modification.
Thus using the Concurrency analysis you can see how effectively your application uses the available resources.
Locks and Waits
This type of analysis is meant for revealing one of the most widespread reasons for ineffective usage of paralleling in an application: the incorrect usage of synchronization objects.
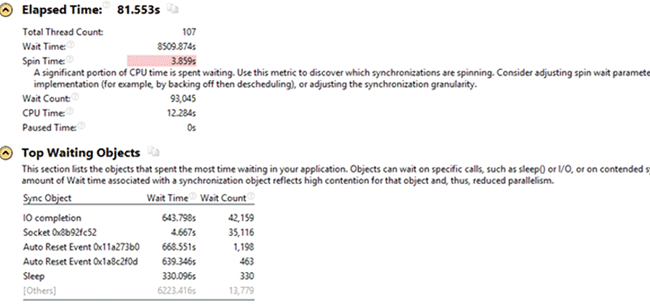
This type of analysis was used to solve the problem with the server upload speed slowdown (it was used in the Hotspots example). The slowdown occurred after adding the thread pool for the operation of writing to server. We received the following results after launching the Locks and Waits analysis:
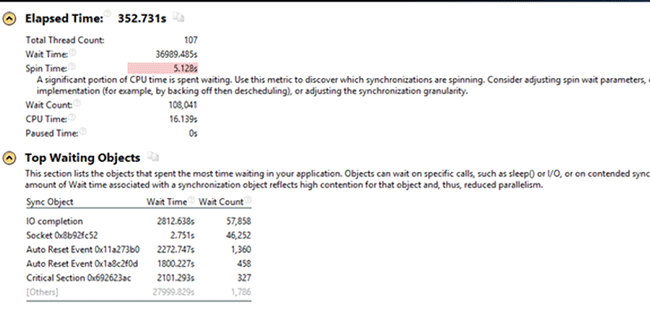
The only unknown object from the Top Waiting Objects list was CriticalSection 0x692623ac. The objects listed above it are the sync objects for the threads that were used in the server before the new feature introduction.
To deal with the critical section, we move to the Bottom-up tab:
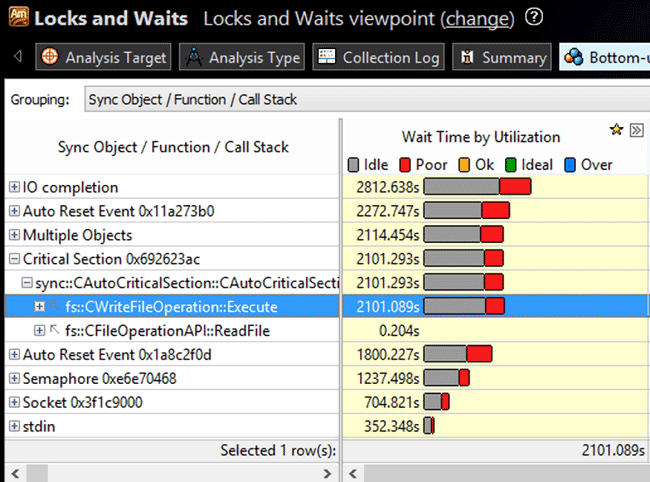
The results show that the idle time in this critical section corresponds to the writing operation. After searching the stack, we found out that this section got locked right on the execution of a new thread.
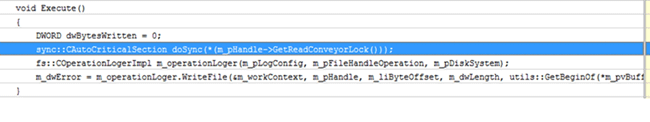
After analyzing the whole stack of the thread, we found out that the locking of the section could be moved to the top of the stack. We received the following results after launching the Locks and Waits analysis for the modified version once more:
As we can see the Critical Section 0x692623ac is absent from the Top Waiting Objects list, and the upload to server became much faster. Thus the Locks and Waits analysis allows effectively configuring a multi-thread application.
3. Intel Vtune Amplifier alternatives
And now an untypical for a Vtune tutorial part. While the software is a good profiler, not everyone can afford it, that is why we have performed a research to find other utilities for application performance analysis. As VTune integrates into Visual Studio, we examined the profilers that work in this environment. Some alternatives were found.
The first and, perhabs, the best alternative is the profiler integrated into Visual Studio 2010. It provides 4 types of analysis:
- CPU sampling – estimates the CPU load;
- Instrumentation – counts the number of function calls and their execution time
- .NET memory allocation – tracks the allocation of memory;
- Concurrency – examines the sync objects.
You can find more details on this profiler here.
The second option we found is CodeAnalyst Performance Analyzer. It provides the such analysis types:
- Code “critical” places localization;
- The sync objects and CPU load analysis.
Conclusion
After analyzing the VTune main features, we can say that it has an easy-to-use interface and very rich functionality. This article is just a short VTune tutorial and not features were considered. To study the project in details, we recommend reading the information on the official website. We can make a conclusion that using VTune you can easily create an optimal configuration for your application.
Have a question?
Ask our expert!
Program Manager


