 Skip to main content

Ensuring thorough quality assurance (QA) and testing processes for your software before its release is essential. The activities we described in our mobile testing overview help you detect and eliminate various defects as well as make sure your solution performs flawlessly. However, building and executing an efficient software testing strategy can be challenging when your project has a limited budget and time frame.
The devil is in the details. Metrics are an effective way to get quantitative information about the quality of your product and processes, your project’s progress, and the skill set of people on your team. But with a great variety of these metrics, it’s not always obvious which to choose.
This article contains recommendations on how to choose metrics for making proactive decisions. You’ll find the most important types of testing metrics followed by real-world examples with explanations.
This article will be useful for test and QA specialists as well as for project managers who want to improve their software testing strategies and learn more about choosing, tracking, and reporting software testing metrics.
Contents:
Software testing metrics: definition, pros and cons, how to choose
Software testing metrics are quantifiable indicators of the progress, quality, and productivity of the testing process. They help test engineers check how efficiently software and its components work.
Metrics are an important part of many quality models and standards including Capability Maturity Model Integration (CMMI), Test Maturity Model Integration (TMMI), and Test Process Improvement (TPI).
Test engineers use software testing metrics to:
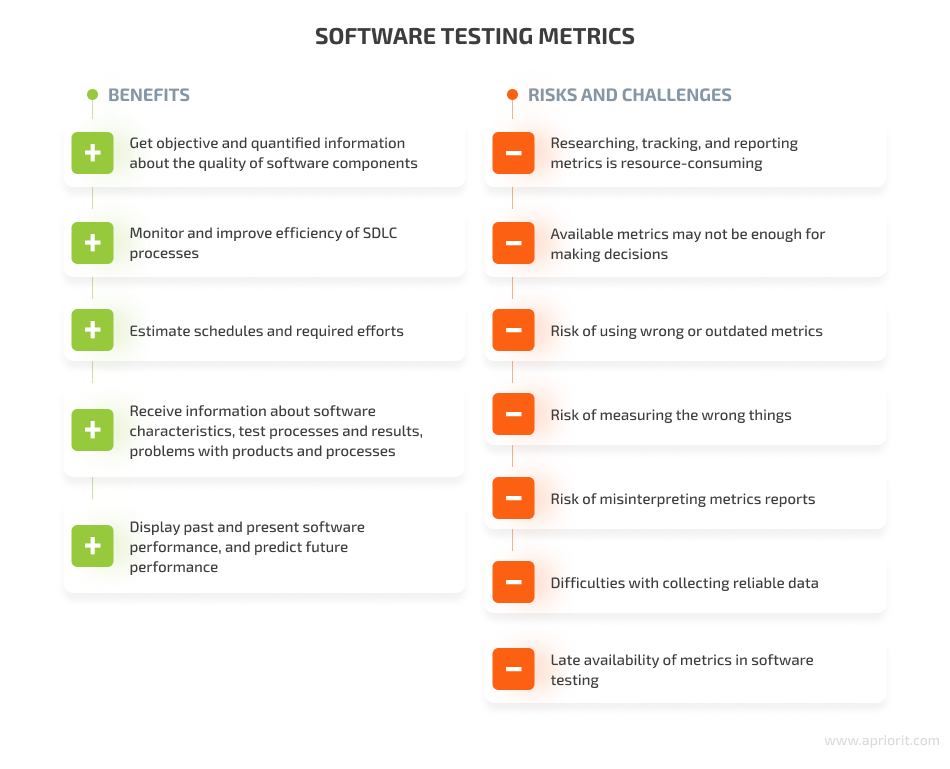
- Get objective and quantifiable information about the quality of software components and features during all stages of testing
- Display past and present performance as well as predict the future performance of a product’s components
- Estimate schedules and required testing efforts
- Monitor and improve the efficiency of the software development life cycle (SDLC).
- Receive information about characteristics of the product being tested (size, quality, risk, complexity), test processes (progress, effectiveness, efficiency), test results, and problems with products and processes
However, there are hidden risks and challenges to using software testing metrics:
- Researching, tracking, and reporting metrics is resource-consuming
- Available metrics may not be sufficient for making decisions
- Risk of using wrong or outdated metrics
- Risk of measuring the wrong things
- Risk of misinterpreting reports
- Challenges of collecting reliable data
- Late availability of QA metrics in software testing
By keeping these risks and challenges in mind, test engineers can efficiently plan their work with testing metrics and avoid problems when applying metrics during the testing process.
How to choose test metrics
There are no universal metrics or best practices you can apply to every process. When choosing which metrics to use, test engineers rely on the objectives of the particular test process.
Identifying objectives for the testing process and actual software quality may be challenging, as QA and test specialists might have unrealistic expectations for their projects (such as finding and fixing all code defects) or might underestimate how many hours testing will actually take.
One way to choose test objectives is by choosing from the four most common as defined by Rex Black in Metrics for Software Testing: Managing with Facts, Part 1: The How and Why of Metrics:
- Find defects, especially important ones
- Build confidence in the software product
- Reduce the risk of post-release failures
- Provide useful, timely information about testing and product quality
You can have other objectives for your project.
If you’re working on a driver, check out our article on how to test a Windows driver.
With that in mind, let’s discuss the general strategy for working with software testing metrics.
How to use testing metrics effectively
In short, your goals define the set of metrics you need to use for each specific project. Once your metric set is formalized, you need to define your processes for tracking, reporting, and decision-making. Let’s take a close look at each step:
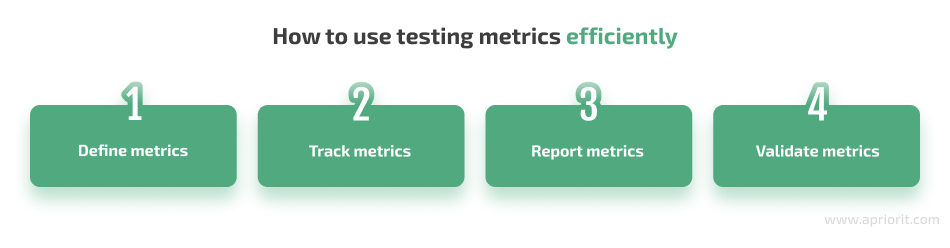
1. Define metrics
It’s better to choose a limited set of relevant metrics based on specific objectives for your project, process, or product. Selecting these metrics can be far from easy, as effective metrics should be:
- Simple to understand and interpret
- Objective to meet business goals and objectives
- Measurable so they can be reliably defined
- Meaningful to provide valuable information
- Reliable so they can provide consistent results for a specified period of time
- Valid to ensure they measure exactly what you need to know
- Easy to collect so they can be gathered automatically or manually but without intruding on the testing process
It’s best to start with basic metrics and apply complex ones when you need more details. A good practice is to use a set of metrics that balance and complement each other so they reflect the entire picture. Once QA specialists select testing metrics, they present them to stakeholders and team members to avoid confusion when metrics are discussed.
2. Track metrics
Tracking metrics is the process of collecting data and interpreting results.
You should determine who will collect data, when and how they will do so, and where that data will be stored. After that, you need to define methods for analyzing and visualizing your data. Data analysis usually requires patience to carefully investigate possible divergence from expectations in actual measurements and understand reasons for that divergence.
You can use products that help you at least partially automate metrics tracking. There are both commercial test management solutions like TestRail, Jira, and Zephyr, as well as free tools such as filters in your ticketing system and Google Sheets.
It’s essential to track metrics regularly during the testing process and even after the product release to further improve software quality. You can also analyze results in comparison with previous releases and targeted values to see progress.
3. Validate metrics
QA and test specialists must verify the information received from tracking metrics before reporting it. Measurements for a metric may not reflect the true status of the test process or may convey an overly positive or negative trend.
Before any data is presented, test engineers have to review it for both accuracy and the message it’s likely to convey. Besides, it’s a good idea to validate measurements over time, as a specific metric on its own may be interpreted differently than agreed in the metric definition phase.
4. Report metrics
The main objective of reporting software testing metrics is to provide an immediate understanding of the state and quality of a project for management purposes.
Metrics are usually reported during meetings of team members or stakeholders using visualizations. You can also share information about metrics using your corporate content management platform so they’re available whenever necessary.
Read also:
6 Ways to Improve Software Testing
4 key types of software testing metrics
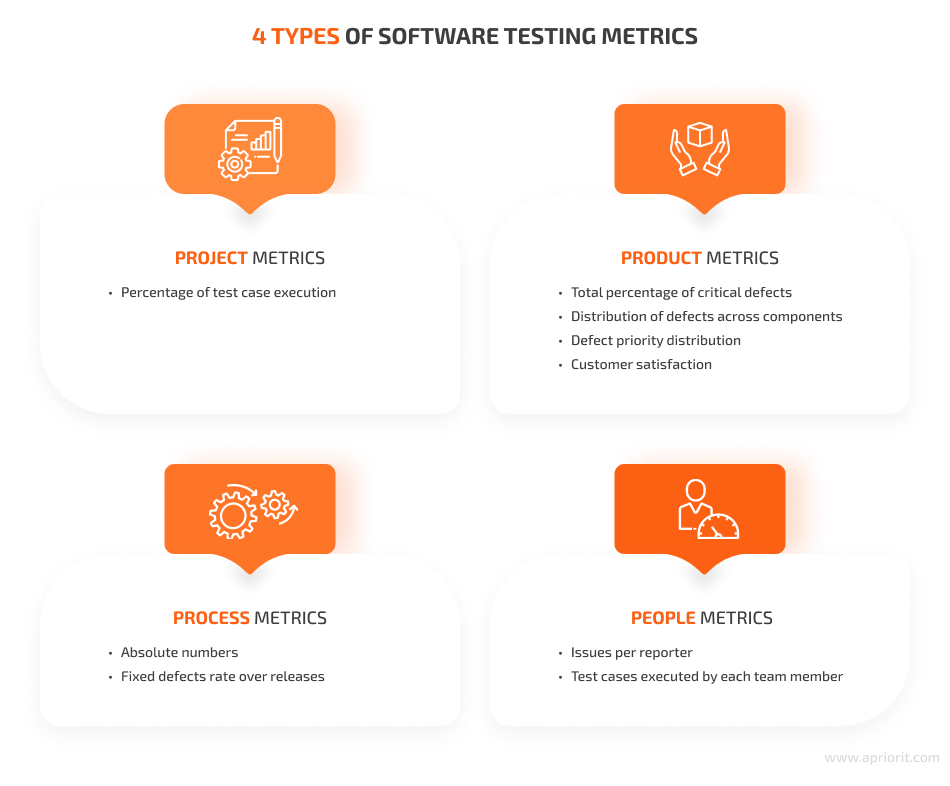
Testing metrics can be classified differently depending on your objectives. According to Rex Black’s series of articles Metrics for Software Testing: Managing with Facts, test activity metrics can be grouped into four main categories:
- Project metrics define where the team stands on the project and how close it is to achieving project objectives.
- Product metrics in software testing determine whether product quality is on track for successful delivery.
- Process metrics measure the capabilities of product testing.
- People metrics assess the skill level of the team as a whole and each member individually.
Note that testing metrics can belong to more than one category. For example, the rate of reported defects can be interpreted either as a project, product, or process metric.
Project metrics aren’t closely associated with software quality, in contrast to product and process metrics, so below we’ll explore only one project metric. Also, people metrics aren’t always used in the testing process because of their sensitivity. However, both of these types can be included in your metrics program as normalizing factors that measure the number of testers and their skills or the size of the project.
Let’s explore different types of measures to test a product’s quality in detail and list a few crucial metrics for each.
1. Project metrics
Project metrics measure progress toward established project completion criteria, such as the percentage of test cases executed, passed, and failed before a release, sprint, or some other event. Let’s explore the percentage of test case execution metric in detail.
1.1. Percentage of test case execution
This metric indicates testing progress by providing the percentage of executed tests out of all planned tests. For more detailed information, you can also measure the separate rates of passed, blocked, and failed test cases.
How to measure: Percent of Test Case Execution = (Number of Passed Tests + Number of Failed Tests + Number of Blocked Tests) / Number of Test Cases
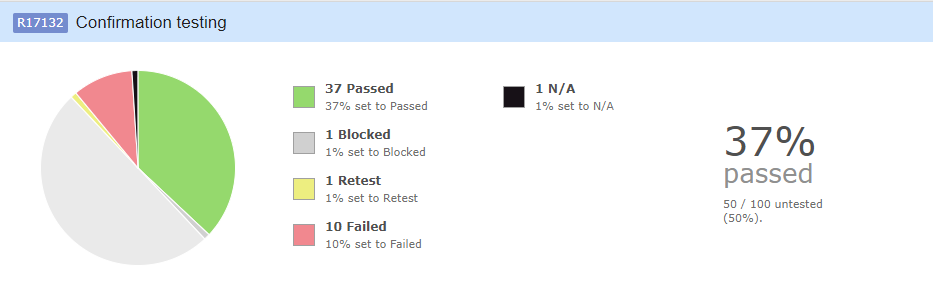
Image 1. Percentage of test case execution
The image above shows test case results grouped by passed, blocked, retest, failed, and unavailable (N/A) tests. The total number of executed test cases is 50, representing 50% of all test cases, with only 37% passed.
The percentage of test case execution will increase along with the progress of testing activities for each group of test cases. Thus, at the product acceptance stage, test case execution should be 100%. If the percentage of test case execution is not equal to 100% by then, the team should review each unexecuted test to determine why it wasn’t run.
You can also use various project management methodologies like earned value analysis that provide universal project metrics.
2. Product metrics
Product metrics measure a product’s quality. The four commonly used product metrics are:
- Total percentage of critical defects
- Distribution of defects across components
- Defect priority distribution
- Customer satisfaction
Let’s explore how to use such metrics in software testing, starting with defects-related metrics.
2.1. Total percentage of critical defects
To understand the current quality of a product or any of its components, QA and test engineers use the total percentage of critical defects.
How to measure: Total Percentage of Critical Defects = (Critical Defects / Total Defects Reported) x 100
2.2. Distribution of defects across components
The overall number of identified defects will be continually reduced as bugs are fixed. However, some components may still have significantly more flaws than others. To identify problematic functional areas, test specialists apply the defect distribution across components metric, which shows how many defects each component has.
It’s also a good idea to make two charts of total defects (including historical and actual, or opened) to see overall progress alongside the number of defects that still need to be fixed.
How to measure: Defect Distribution Across Components = Total Number of Defects / Functional area(s)
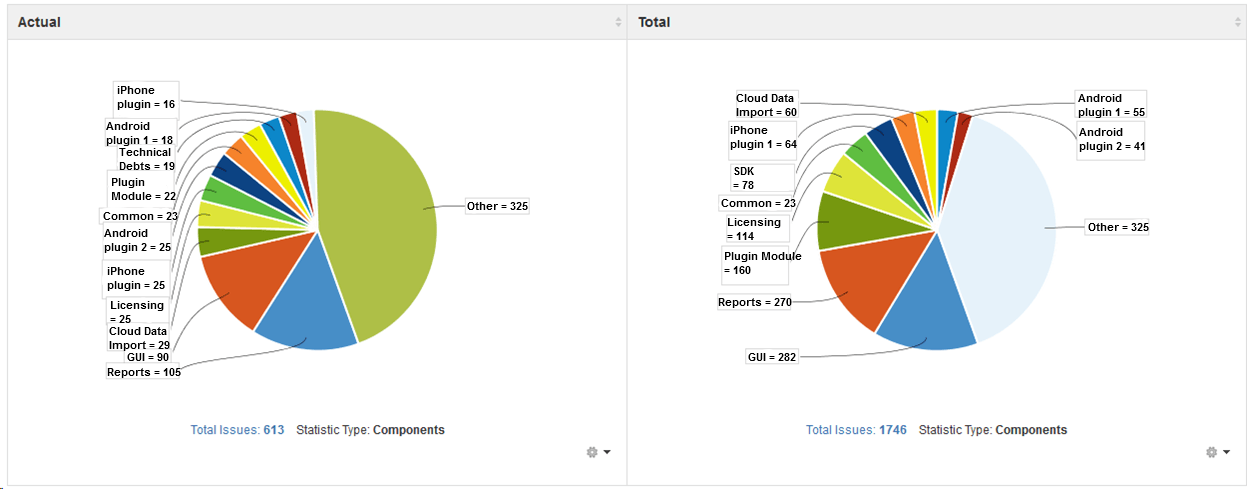
Image 2. Total and actual distribution of defects across components
The defect distribution pie charts above show the total number of defects per component, the number of unfixed actual defects, and the components with the most defects. From the example above, we can conclude that such important components as the reports module and the GUI require close attention from the test team.
2.3. Defect priority distribution
After compiling records regarding defects found in all functional areas of the product, the test team can prioritize defects and decide which component requires more attention at the moment.
The distribution of defects with certain priority levels across components can shed light on the effectiveness of testing efforts.
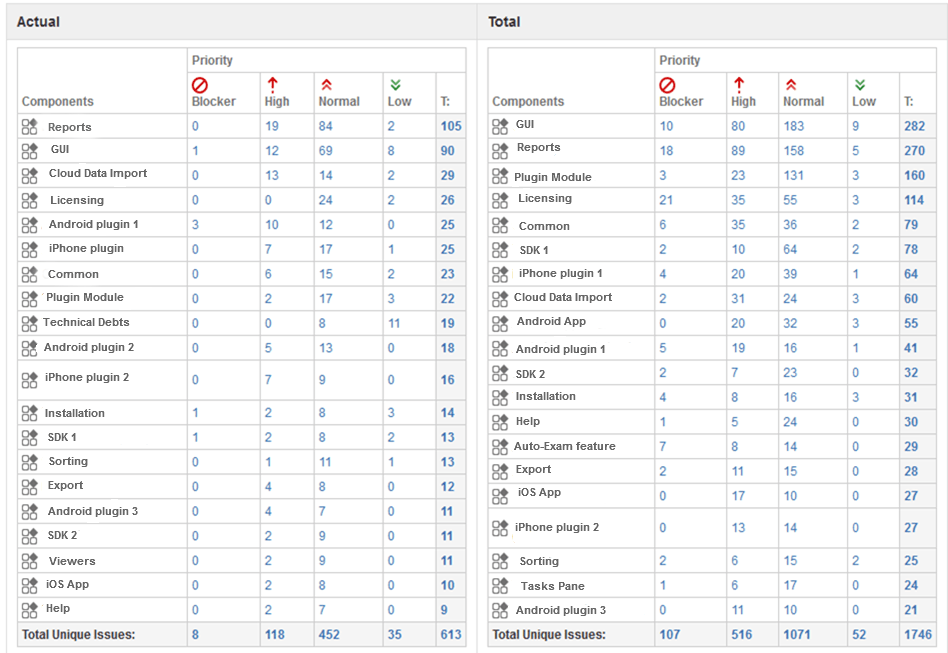
Image 3. Actual and total defect priority distribution
The tables above show the number of total and actual defects along with priorities across different product components. In this example, we categorized all defects using the following priority groups: blocker, high, normal, and low-priority. You can see that licensing has only normal-priority defects, which means that this part isn’t critical now. Although there are many unfixed defects in reports and the GUI, only a small number of them are high-priority.
2.4. Customer satisfaction
To fully validate the team’s efforts, it’s essential to take the customer’s perspective into consideration. Customer feedback is important because customers may perceive the product differently than developers and QA specialists. For example, it may turn out that a feature considered important by developers isn’t so important for customers. To learn more about customer satisfaction, you can use the customer issues level metric.
How to measure: Customer Issues Level = Defects Reported by Customers + Help Desk Calls + Customer Surveys
The charts below show the results of a customer survey that provides information about customer satisfaction with particular features: the graphical user interface (GUI), feature #1, and the updating process.
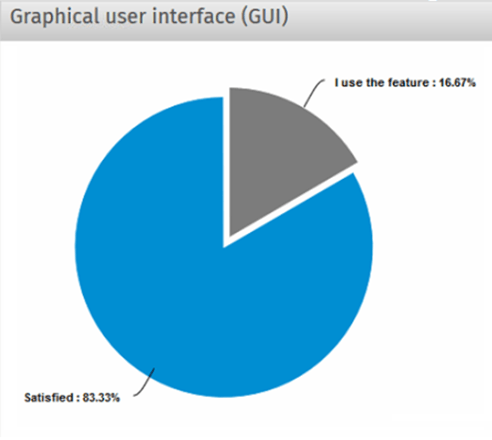
Image 4. Customer feedback on the GUI
The chart above shows that most customers are satisfied with the GUI.
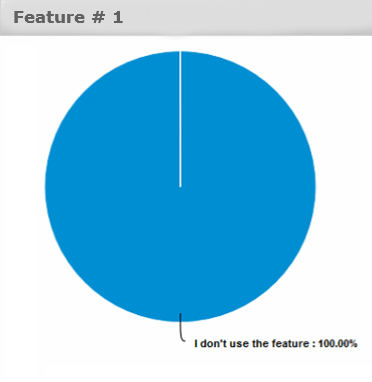
Image 5. Customer feedback on feature #1
The chart in Image 5 illustrates that a feature that was considered important by developers appears to be useless for customers.
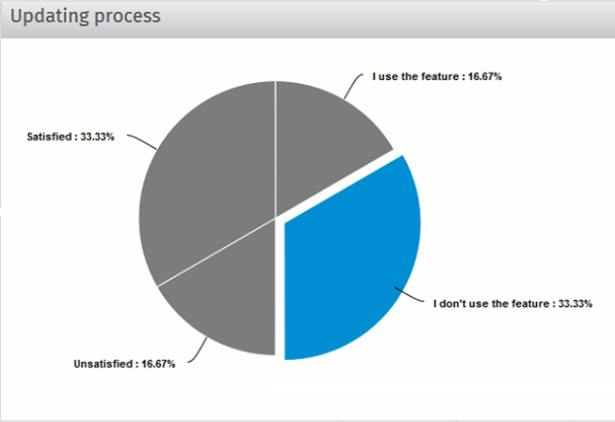
Image 6. Customer feedback on the updating process
Such surveys can also reveal problems that aren’t usually reported by customers. The reason is that customers rarely complain about the inconvenience of the updating process, but a survey can reveal that customers aren’t satisfied with it.
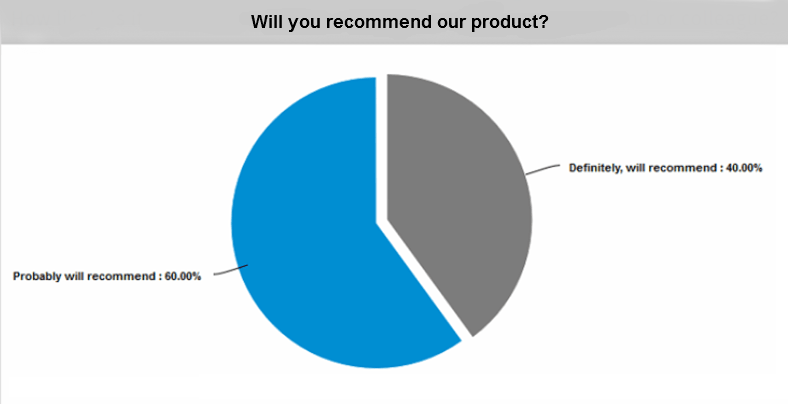
Image 7. Feedback on whether customers would recommend the product
This chart about customers’ readiness to recommend the product shows that the product’s quality is good enough.
3. Process metrics
Process metrics measure the capabilities of the testing or development processes, such as bug fixing progress and the defect detection percentage during testing. Note that these metrics measure process capabilities but not the capabilities of test team members.
Let’s explore absolute numbers metrics, in particular the percentage of fixed defects over releases metric:
3.1. Absolute numbers
Absolute numbers can provide you with an overall picture of testing progress and efficiency. Process metrics based on absolute numbers can include several measurements depending on your objectives and available data. For instance, you can use the following metrics:
- Percentage of fixed defects helps the team identify the percentage of defects fixed.
How to measure: Percentage of Fixed Defects = (Defects Fixed / Defects Reported) x 100
- Percentage of total critical defects characterizes the development team’s efficiency. A high percentage of critical defects should prompt a development manager to review development tactics.
How to measure: Percentage of total critical defects = (Critical defects / Total defects reported) x 100
- Test effectiveness using defect containment efficiency. The higher the test effectiveness, the better the test set is and the less effort will be required in the long run for test case maintenance.
How to measure: Test Effectiveness Using Defect Containment Efficiency = Bugs Found in Test / Total Bugs Found (pre- and post-shipping) x 100
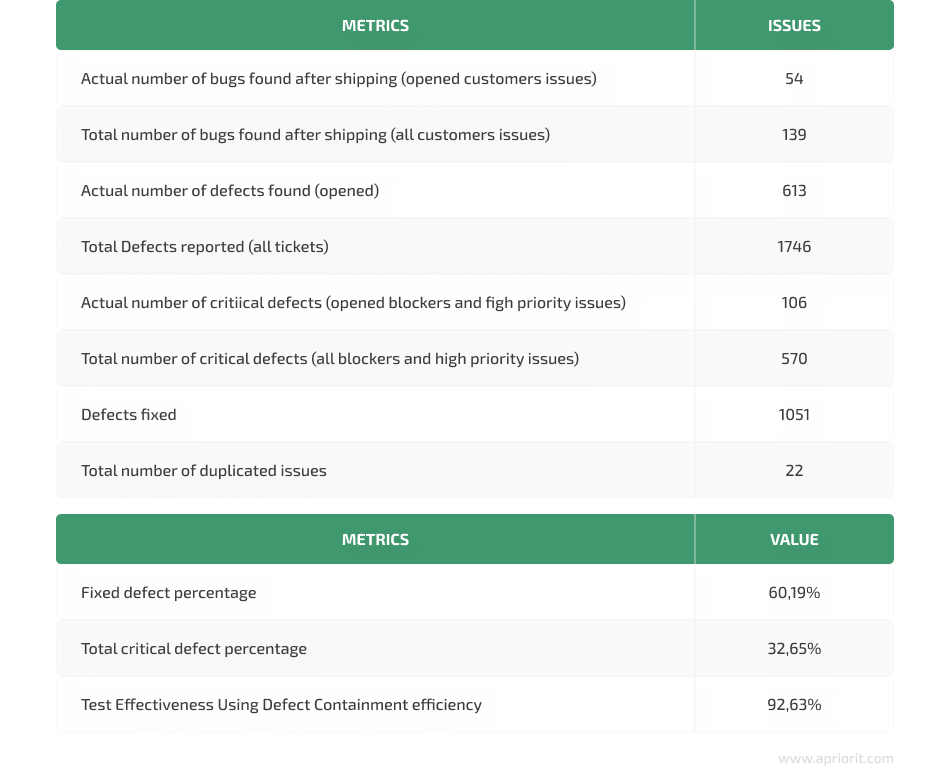
Image 8. Absolute number and efficiency metrics
The table above shows that the percentage of fixed defects is 60.19%. Among total defects, each third bug was a high-priority or blocker. Test effectiveness metrics indicate that only one out of ten defects was found by customers, so test engineers detected the majority of bugs.
These metrics represent only general numbers, and it’s not obvious what to do with them further. To understand whether the team’s efforts at improving the test set show positive results, we need to see the dynamics of these rates across releases.
3.2. Fixed defects rate over releases
This metric allows you to compare testing results from release to release and evaluate how effectively the development team has fixed defects. Additionally, it reveals general trends of bug fixes over releases, and these trends can influence further activity of the team. For more detailed analysis, test managers can also divide fixed defects into priority groups.
The higher the rate of fixed defects, the higher the quality of the product.
However, you should understand that not all defects can be fixed. Some bugs can be fixed only after the product is transferred to another platform. There are also some issues that require a long time to fix or require fundamental changes to the product. Unfortunately, customers are generally interested in new features and don’t want to pay for refactoring. However, any decrease in the bugfix rate is a negative trend, as you may have too many bugs that require fixing over time.
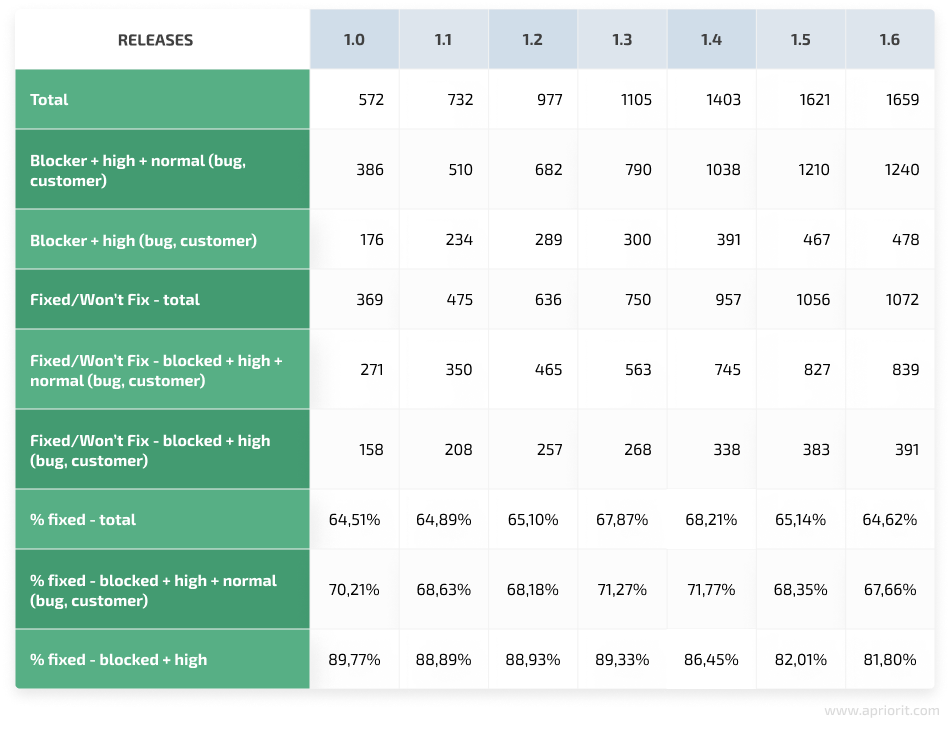
Image 9. A table with the bugfix rate over releases
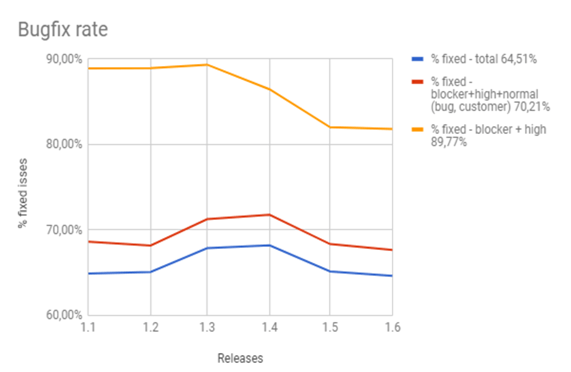
Image 10. Chart of the bugfix rate over releases
The images above reflect a positive increase in fixing blocker, high, and normal bugs reported by the team and customers beginning from release 1.2. But it also shows that the team fixed fewer issues after release 1.4. This trend shows that the team should have fixed more defects. Otherwise, the number of defects will increase over time. However, there’s another trend for high-priority defects and blockers. The effectiveness of fixing these defects was 90% from release 1.1. to release 1.2. After release 1.3, the team fixed fewer defects, but this rate was still above 80%.
4. People metrics
People metrics measure things such as issues per reporter or test cases executed by each team member. It’s best to be careful with these metrics, as you also need to take into account employee motivation and professional skills before making any decisions.
4.1. Issues per reporter
Use this metric to monitor how many issues are reported by each team member. In the chart below, some team members reported fewer issues than others. However, this doesn’t mean that these team members worked poorly. Most probably, they dealt with regression testing of bugs that were identified earlier.
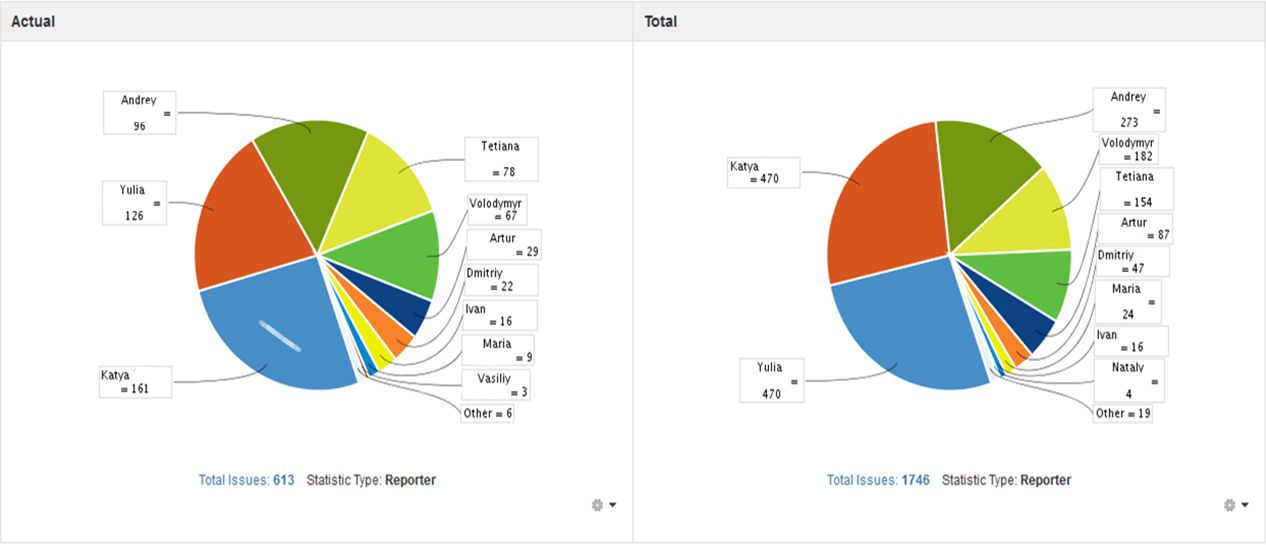
Image 11. Actual and total number of issues reported by each test specialist
4.2. Test cases executed by each team member
The results of this metric are often represented in the form of a chart showing test cases executed by each test team member. This information can help project managers measure the effectiveness of each team member.
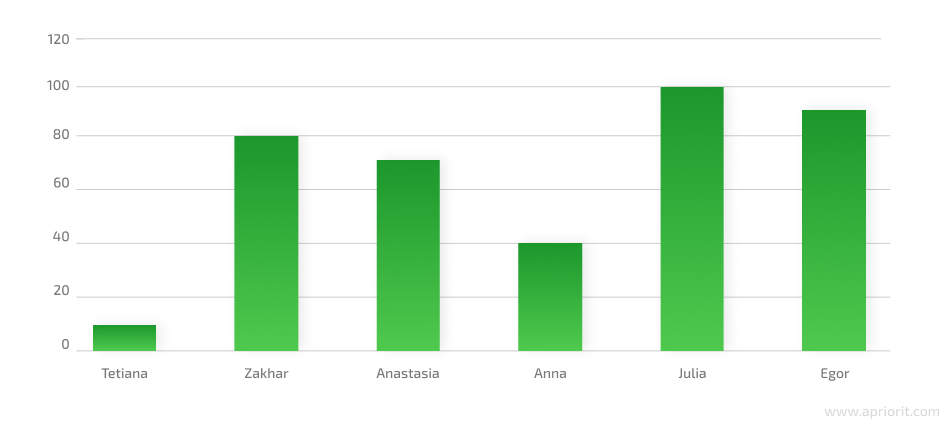
Image 12. Chart of test cases executed by each team member
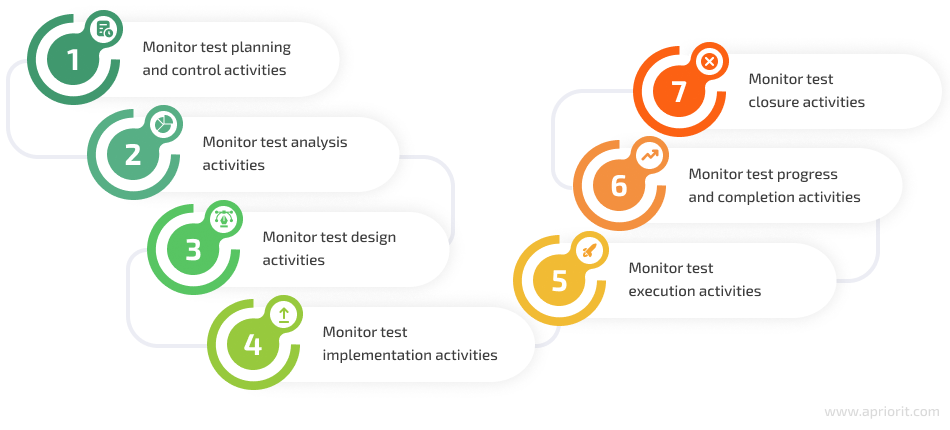
All metrics should be linked to testing activities so that a project manager can see all the details.
It’s essential to start the testing process as early as possible: from the product idea stage to the support of a released product. QA managers should be able to gather and analyze testing metrics during each development and testing step:
Conclusion
When carefully selected and applied, software testing metrics enhance the overall QA process and help you deliver a reliable and compatible product. Metrics provide objective visibility of software product quality and show how the testing process can be improved.
But choosing irrelevant metrics, or choosing fewer or more metrics than you need, can cause unpleasant consequences like missing severe bugs or exceeding the project’s budget and time frame. The principles we’ve provided for using metrics can help you choose the most relevant metrics for your project and apply them effectively.
To make the most of software testing metrics for assuring top-notch product quality, make sure you gather a team of qualified testing and QA specialists. At Apriorit, we have a strong team of ISTQB-certified engineers who can help you develop and execute relevant QA strategies for projects of any complexity, as well as consult on building efficient test processes.
Contact us for professional QA and testing services. Let’s bring your software quality to the next level!
Have a question?
Ask our expert!
VP of Engineering


