 Skip to main content

One of the major parts of the SaaS development life cycle is keeping the software operational and responding promptly to incidents. These incidents could be the result of product component failures or degraded performance. The key to success here is choosing the right tools and configuring them properly to monitor production and staging environments. These tasks generally rest on the shoulders of DevOps and SysOps engineers and must be planned before moving to the production phase.
In this article, we provide an overview of resource monitoring tools offered by Amazon Web Services (AWS) and Microsoft Azure (the most popular public cloud providers) as well as tools that can be used to monitor resources for your SaaS product whether you use a public or private cloud.
Contents:
Why monitor your infrastructure?
Monitoring is an essential part of SaaS solution development. There are several reasons why you need to monitor your production infrastructure:
- To allow SysOps engineers to spot problems quickly, before they’re noticed by end users
- To plan for workload increases caused by new users
- Because it’s an integral part of workload and performance testing
- To estimate production infrastructure performance in real time
- To gauge overall system accessibility
- To estimate the cost of infrastructure (if using a public cloud)
Public cloud provider monitoring tools
Next, we’ll take a detailed look at the monitoring tools offered by AWS and Microsoft Azure.
AWS infrastructure monitoring
When it comes to monitoring AWS infrastructure, the first and perhaps only tool you’ll need is Amazon CloudWatch. This service consists of several parts.
CloudWatch metrics repository
Essentially, Amazon CloudWatch is a repository of metrics supplied by AWS services. CloudWatch monitors your AWS resources and the applications you run on AWS in real time. A metric is a variable (a time-ordered set of data points) that’s being monitored, and data points represent the value of that variable over time. CloudWatch can be used to collect and track metrics including CPU usage, disk read/write operations, memory usage, and network activity.
In addition to monitoring, CloudWatch Alarm will either automatically send a notification when a metric reaches a threshold you specify or will initiate Auto Scaling. After the workload is reduced, instances that are no longer being used can be terminated automatically to save resources.
In addition to default AWS metrics, you can also monitor your own custom metrics.
You can see the basic architecture of CloudWatch in Figure 1.
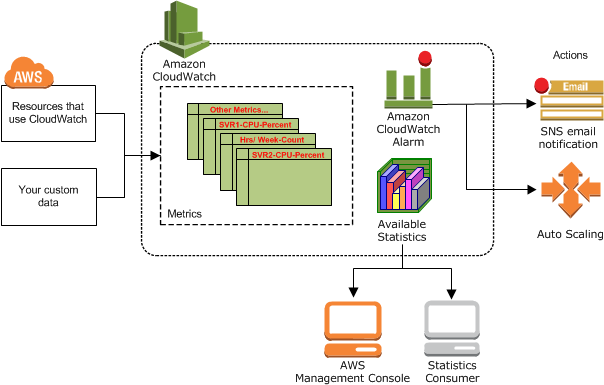
Figure 1. CloudWatch architecture
CloudWatch can be managed either through the AWS console or by using the AWS command-line interface, the CloudWatch API, or the AWS SDK.
Keep in mind a few limitations when using CloudWatch:
- CloudWatch can’t aggregate data from several regions and you can’t see metrics from different regions on the same dashboard.
- There’s a limit of five actionable items for one alarm.
- The maximum metric frequency is once a day and it can’t be customized for longer periods.
- Collected metrics can’t be manually removed. On the other hand, they’re deleted automatically after 15 months.
- Data points with a period of less than one minute are available for three hours. After this initial three hours, the metrics are aggregated and remain available for 15 days with one-minute resolution. After 15 days, the data is still available but is aggregated further and is retrievable only with five-minute resolution. After 63 days, the data is only available with a resolution of one hour.
CloudWatch Events
This service collects various events that describe changes to AWS resources.
For example, an event is generated when the state of an EC2 instance changes from Running to Terminated, or when Auto Scaling launches new instances, or when a new S3 bucket is created. There’s also an option to generate these events from your application using the AWS SDK.
CloudWatch Logs
This feature allows you to collect logs from EC2 instances, AWS CloudTrail logs, and Route 53 DNS query logs. Additionally, application logs such as Apache and IIS web server logs can be collected. All collected logs can be kept indefinitely or retained for any period between one day and ten years.
As you can see, AWS CloudWatch offers a complete set of tools for infrastructure monitoring. It allows you to monitor real-time infrastructure performance metrics as well as any infrastructure changes and collects application logs while retaining them without any restrictions.
Microsoft Azure infrastructure monitoring
If you use Microsoft Azure resources as an infrastructure for your application, then Azure Monitor is worth your attention. It provides access to various infrastructure metrics as well as most Azure service logs.
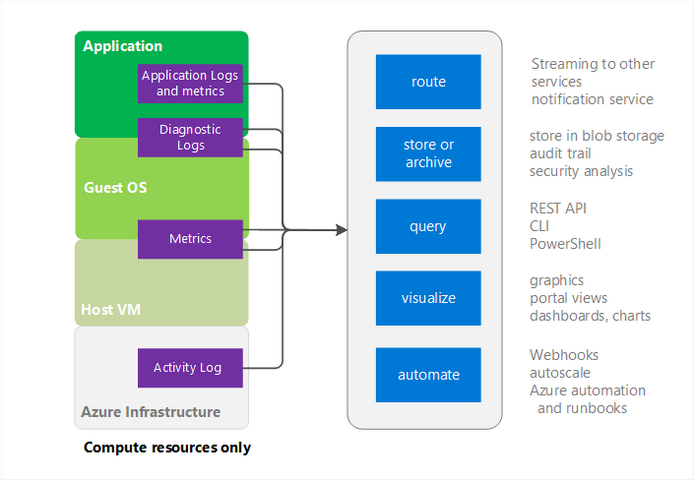
Figure 2. Azure Monitor architecture
As you can see in the illustration above, application logs, performance counters, and activity logs (start/stop, etc.) can also be used as sources of data for Azure Monitor.
After data is collected in Azure Monitor, there are at least four things you can do with it:
- Send the data to EventHub to be used by third-party services or utilities
- Store the collected data in an archive (metrics and logs are available for a 90-day period and can be routed to Azure Storage for longer retention)
- Retain the information for future use by third-party applications (monitoring data can be accessed using the Azure Monitor REST API)
- Reroute the gathered data to Application Insights or Microsoft Power BI for better visualization
One of the most useful features of Azure Monitor is the ability to set metrics-based alerts. For example, you can start additional instances when an application starts, send notifications based on a metric value or log event, or call a specific URL outside of Azure. In addition to Azure Portal, monitoring data can be accessed through PowerShell, the Azure Monitor REST API, and the .NET SDK.
Private and hybrid cloud infrastructure monitoring
When your application doesn’t use a public cloud for infrastructure, a specialized solution can be used for monitoring. There are a number of solutions on the market that are designed to empower those responsible for infrastructure monitoring.
Let’s take a brief look at two of the most popular services: Nagios Core and Zabbix.
Nagios Core
Nagios Core is a free and open source solution. This system is built for infrastructure monitoring and allows you to keep an eye on hosts and services while alerting administrators when services stop or start. Nagios Core has many capabilities and allows you to monitor network services (SMTP, POP3, HTTP, NNTP, ICMP, SNMP) as well as Linux and Windows hosts (CPU load, disk usage, system logs). The system is quite flexible and can be customized using common languages such as C++, Perl, Python, PHP, and C#. Just like all monitoring systems, Nagios Core can send an alert when there’s a problem with a service or host (see Figure 3).
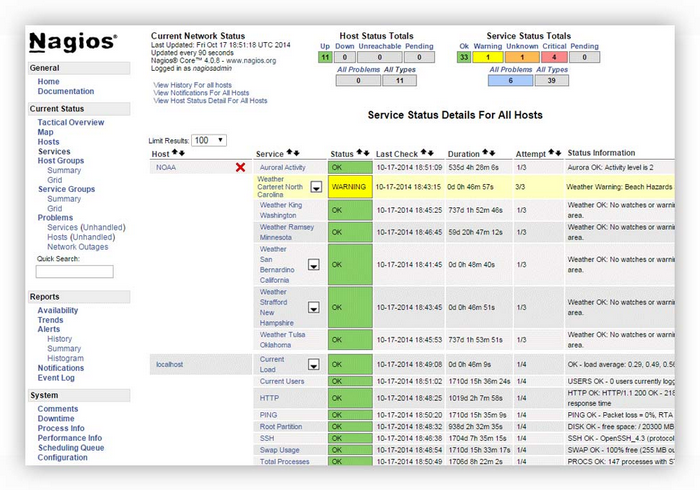
Figure 3. Nagios alert history
Nagios consists of two parts.
The first part is the server part (Nagios Core), which processes data from agents and external applications and sends alerts when a critical state is reached. Nagios Core can be installed only on UNIX and UNIX-based operating systems.
The second part is the client part (agents). Agents monitor the performance of servers and workstations running Windows or Linux.
Note that UNIX systems require NRPE (Nagios Remote Plugin Executor Addon) plugins, which are available at the Nagios Exchange, while Windows systems require NSClient++. Without agent software installed, Windows and Linux systems can be monitored through Simple Network Management Protocol (SNMP) queries.
The main drawback of Nagios is its lack of a GUI for system configuration. All settings are stored in configuration files that need to be edited manually, followed by a Nagios restart. On the other hand, one of the main advantages of Nagios Core that differentiates it from other products is its huge library of free and commercial plugins for every occasion.
Zabbix
Zabbix is a monitoring system released under the GNU General Public License (GPL) version 2. The system consists of four parts:
- A monitoring server that collects data, processes and analyses it, and starts alert scripts
- A database (MySQL, PostgreSQL, SQLite, or Oracle)
- A web interface written in PHP
- Daemon agents that run on monitored hosts
The daemon agents support active and passive modes. In active mode, a daemon agent independently sends new values to the server with a predefined periodicity. In passive mode, the agent only responds to data requests from the server.
The agent is optional, as you can also monitor your infrastructure with the help of SNMP protocol (v1, v2, v3), device queries, or SNMP Traps, or by running external scripts.
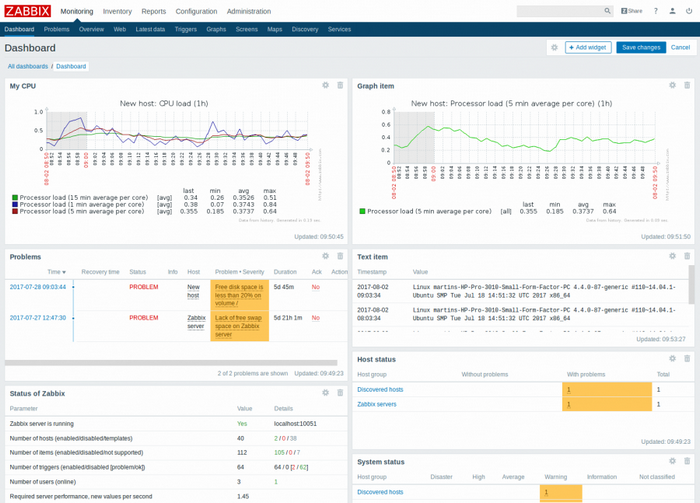
Figure 4. Zabbix dashboard
The Zabbix architecture allows you to redistribute its parts to several hosts during increased workloads. Zabbix also provides an easy-to-use library of templates, which can significantly reduce the initial configuration time. Another undisputable advantage of Zabbix is the ability to configure the system as well as additional templates using a web interface.
Choosing a monitoring system
You should consider several aspects when selecting an infrastructure monitoring system.
- First, evaluate the functional capabilities of the monitoring system to determine whether they meet your technical and business needs.
- Then evaluate the specifics of system deployment and maintenance to make sure it corresponds to your team’s skill set and resources.
- Lastly, calculate the total cost of ownership, which will include licenses and system maintenance.
Monitoring system maintenance tips
As you can see, picking the right monitoring system is quite challenging. The following tips will make it easier for you to choose and maintain a monitoring system for your SaaS project:
- Evaluate a trial version first. If you opt for a commercial system, you may run into some restrictions that may be critical for you.
- Monitor only necessary metrics. Don’t try to cover all possible data points, as this can lead to missing something important due to information overload.
- Always test configured metrics and alerts. Make sure your alerts are working. Otherwise, you risk learning about certain infrastructure issues from end users.
- Monitor the state of your monitoring system. Keep an eye on your monitoring system to make sure that it’s functioning normally. If something happens to your monitoring system, you won’t know about it until your end users report a new infrastructure issue.
- Assign an incident response team to react to monitoring system alerts. Alerts and notifications are useless without a quick response.
- Use the same metrics for different environments. It’s important to use the same metrics when monitoring production, staging, and testing environments. This way you can keep your data points consistent when testing new product versions.
Read also:
Keyword-Driven Testing with Robot Framework
Conclusion
Choosing, setting up, and maintaining the right tool for monitoring resources and infrastructure of your SaaS project is challenging. Depending on the platform your SaaS project is based on, you can choose a standard monitoring solution offered by a large cloud provider such as Microsoft Azure or AWS or pick a third-party infrastructure monitoring tool. In any case, you need to take into account both the benefits and drawbacks of a particular solution before making the final decision.
At Apriorit, we have a strong combination of web development and DevOps skills, allowing us to build and maintain ambitious SaaS projects. We’ll be glad to provide a consultation on your solution.
References
https://docs.microsoft.com/en-us/azure/monitoring-and-diagnostics/monitoring-overview-azure-monitor
Have a question?
Ask our expert!
VP of Innovation and Technology, Canada Branch Director


