 Skip to main content

Ever been in a situation where your software doesn’t behave like it should and your team has no idea why? When your software loads slowly, crashes unexpectedly, and returns errors, investigating these issues can take way too long. Especially if your software is distributed between multiple data centers and cloud instances.
That’s where an observability system comes in handy — a part of the DevOps pipeline that monitors important system parameters and analyzes system behavior. In this article, we examine how a product can benefit from an observability system. Apriorit development experts also show a practical example of building such a system with Grafana, AWS, and Terraform.
This article will be useful for technical leaders who are considering implementing their own observability system and are looking for advice based on practical experience.
Contents:
- The role of observability in software development
- Core components of an observability system
- AWS infrastructure design
- Building an effective observability stack: a step-by-step guide
- 1. Structure Terraform modules
- 2. Deploy observability tools as ECS services
- 3. Integrate OpenTelemetry collectors
- 4. Visualize data and set up alerts with Grafana
- Conclusion
The role of observability in software development
What is observability in software?
Observability is the ability to understand what is happening inside a system by examining the data it produces, such as logs, metrics, and events. It allows your team to keep an eye on system behavior without having to predict every possible failure in advance.
While observability systems are similar to monitoring tools on the surface, they in fact solve different issues:
- Monitoring tools help your team answer the question What’s wrong with my system? by checking for failures, spikes in health metrics, and suspicious events. They allow you to analyze and resolve issues that have already occurred or are happening in real time. For example, monitoring tools are useful for understanding why a machine crashes when performing an operation.
- An observability system helps you answer the question Why does my system behave a certain way? by collecting all logs, traces, and metrics on certain processes or activities. It detects any changes in processes your team wants to watch, even if these changes aren’t abnormal. For example, observability tools can notify your team that CPU usage is slightly higher than usual when performing a certain action, even if it doesn’t lead to decreased performance or crashes.
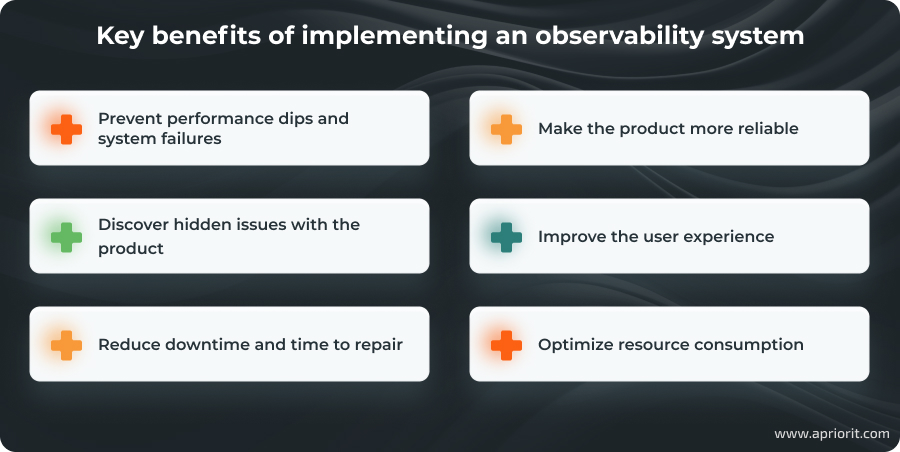
In this way, an observability system can help a business to:
While any software system can benefit from observability, it’s especially useful for systems that rely heavily on real-time data and connect with numerous endpoints, making failures costly to fix and prone to triggering more errors or downtime. Such systems include distributed systems like SaaS, containerized applications, IoT-based solutions, and AI models.
An observability system for each of these product types will have its own architecture, internal logic, and set of tools. In this article, we share how to implement an observability system based on our experience with AWS-based products.
Want to go beyond performance monitoring?
Collaborate with Apriorit’s DevOps engineers to build a system that lets you continuously improve and grow your product rather than put out fires.
Core components of an observability system
For our sample project, we’ll combine several key architectural components to ensure observability: Grafana, Loki, Mimir, and Nginx. Here’s how they’ll interact with each other:
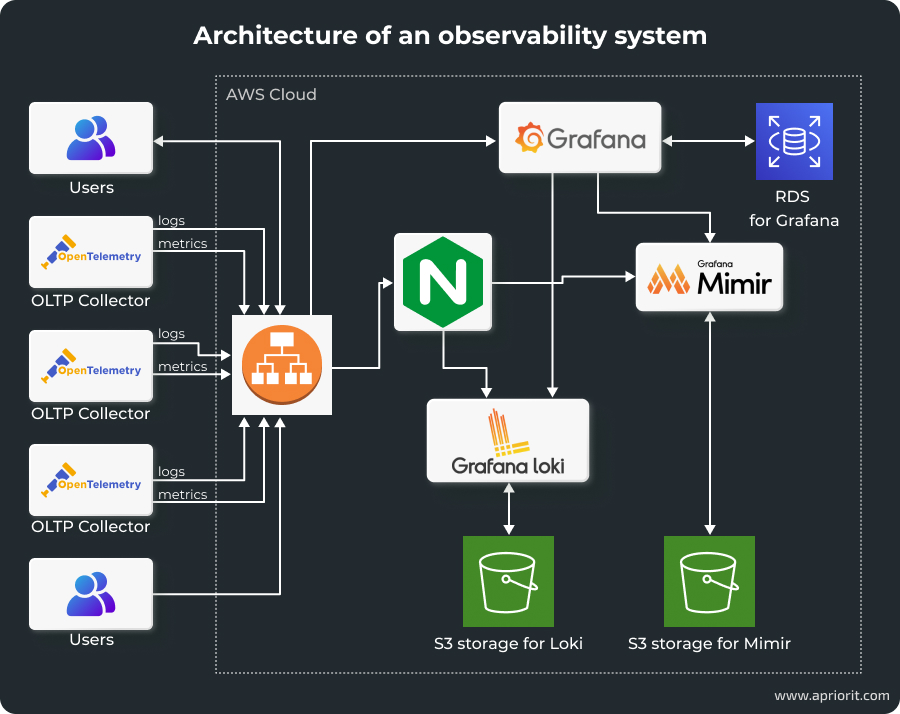
Let’s take a closer look at the tools we’ll use:
- Grafana is an open-source tool that requests information from databases, builds interactive visualization dashboards, and sends alerts on various events. In our system, it will serve as a visualization and monitoring component.
- Loki is a log aggregation system designed to collect, store, and query log data. Unlike traditional log management solutions, Loki indexes only the metadata of logs, which significantly reduces storage costs and improves performance. It integrates tightly with Grafana, allowing logs to be visualized alongside metrics for a unified observability experience.
- Mimir is a scalable metrics storage solution built to handle large volumes of data with high availability and reliability. Mimir integrates with Grafana to provide detailed metric visualizations and supports multi-tenancy.
- Nginx secures data flows across observability components by serving as a reverse proxy. It manages authentication and authorization for access to Loki and Mimir, encrypts data in transit, and enforces rate limiting and request filtering. This way, Nginx ensures that the observability stack remains resilient against malicious attacks and unauthorized access attempts.
- AWS Cloud Map facilitates service discovery and allows Grafana, Loki, Mimir, and Nginx to locate and communicate with each other dynamically. This ensures that as services scale or move, the observability components can maintain reliable connections without manual reconfiguration.
- OpenTelemetry collectors gather data from various exporters and send it to Mimir and Loki through Nginx. This pipeline ensures that metrics and logs are consistently collected, securely transmitted, and accurately stored for visualization and analysis in Grafana.
This observability stack provides a unified platform for monitoring complex applications and ensures visibility into system performance and health in a secure way. Now, let’s see how we integrate this stack into the AWS environment.
AWS infrastructure design
To deploy this observability system in AWS, we need to use the following AWS services:
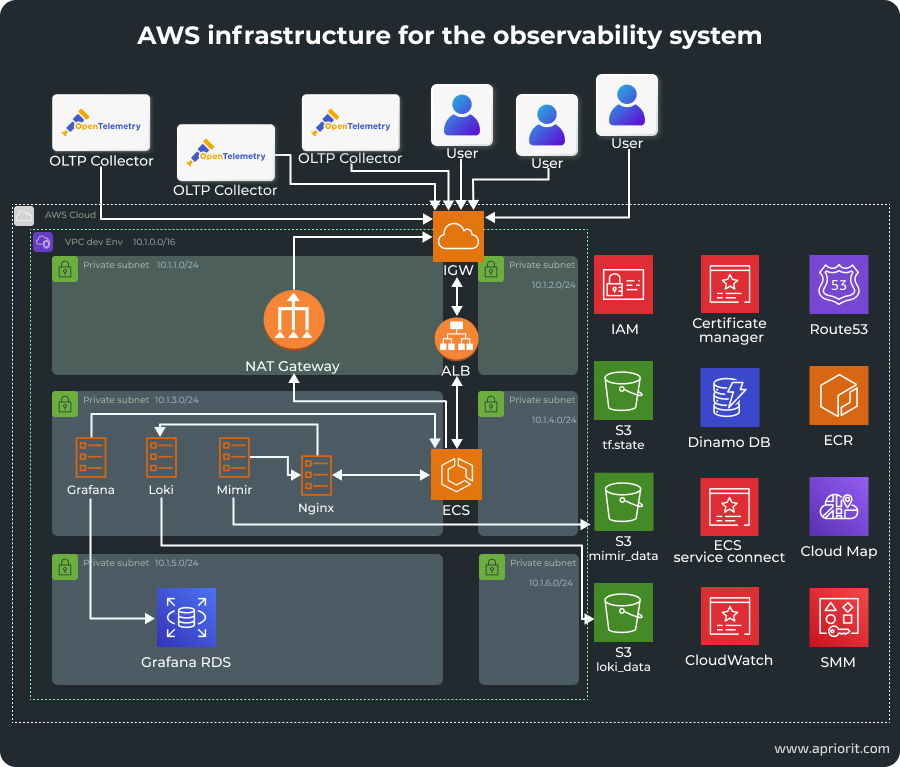
- Virtual Private Cloud (VPC) serves as an isolated network environment where all resources reside and are segmented into public and private subnets. This isolation enhances security by controlling access to critical components and ensuring that sensitive data remains protected within the private subnets.
- Elastic Container Service (ECS) is a scalable container orchestration service that we’ll use to manage the deployment and orchestration of observability tools. It helps us automate tool deployment, scaling, management, and integration with ALB.
- Application Load Balancer (ALB) distributes incoming traffic across multiple ECS tasks. ALB operates at the application layer, enabling advanced routing based on HTTP/HTTPS protocols. It also ensures dynamic traffic routing, offloads SSL/TLS encryption, and continuously checks the health of ECS tasks to maintain high availability.
- Relational Database Service (RDS) provides persistent storage for application data and ensures high availability.
- Elastic Container Registry (ECR) hosts Docker images for the deployment and management of observability services. ECR integrates seamlessly with ECS, enabling efficient and automated deployment workflows.
- Security Groups act as virtual firewalls for inbound and outbound traffic to resources within the VPC. By carefully configuring security groups, we ensure that only authorized traffic can reach the observability services, mitigating potential security risks.
- The CloudWatch monitoring service collects performance metrics and logs.
- System Manager Parameter Store stores infrastructure and services secrets.
- Cloud Map ensures continuous service discovery and service-to-service communication.
- Route53 allows us to describe domain zones.
- Certificate Manager obtains subdomain certificates.
Now that we know what to use for observability in software development, how to make them exchange relevant data, and how to run them in an AWS environment, we can start implementing this solution.
Read also
Establishing Network Observability: Benefits, Use Cases, Practical Tips
Gain full control over your infrastructure with cutting-edge network observability practices. Explore how to optimize monitoring workflows and resolve issues before they impact users.

Building an effective observability stack: a step-by-step guide
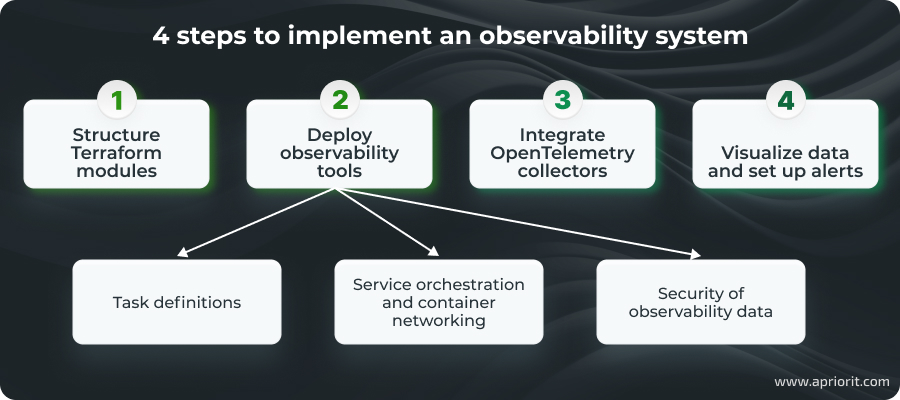
The entire process involves four steps. We won’t cover the basic deployment of AWS services, as this will be handled through Terraform modules.
Instead, we’ll begin by configuring the necessary AWS services using Terraform, then define and connect observability tools within ECS services, configure data collection and security mechanisms, and finally enable visualization capabilities.
1. Structure Terraform modules
Terraform modules will help us maintain a clean, organized, and scalable infrastructure as code setup. Modules encapsulate related resources, promoting reusability and simplifying maintenance.
First, let’s set up a networking module that establishes network infrastructure and ensures secure and efficient communication between services. It uses VPC, public and private subnets, Internet Gateway, NAT Gateway, and Route Tables.
module "vpc" {
  source = "./modules/vpc"
  env	= terraform.workspace
  app	= var.app
  vpc_cidr         	= lookup(var.vpc_cidr_env, terraform.workspace)
  public_subnet_number = 2
  ecs_subnet_number	= 2
  db_subnet_number 	= 2
  region           	= var.aws_region
}Next, let’s work on a security module. It implements security groups and network ACLs to define firewall rules that control traffic flow:
module "sg" {
   source     	= "./modules/security_groups"
   app        	= var.app
   env        	= terraform.workspace
   vpc_cidr_block = module.vpc.vpc_cidr
   vpc_id     	= module.vpc.vpc_id
   depends_on = [module.vpc]
}We also need a computing module to manage load balancing and ensure high availability and scalability using ALB:
module "lb_fargate" {
  source        	= "./modules/load_balancer_fargate"
  app           	= var.app
  env           	= terraform.workspace
  vpc_id        	= module.vpc.vpc_id
  security_groups   = module.sg.sg_alb_id
  public_subnet_ids = module.vpc.public_subnet_ids
  ecs_subnet_ids	= module.vpc.ecs_subnet_ids
  http_port     	= var.http_port
  https_port    	= var.https_port
  certificate_arn   = var.certificate_arn #data.aws_acm_certificate.amazon_issued.arn
  depends_on = [module.vpc, module.sg]
}A database module sets up and configures the relational database service for persistent data storage. It uses RDS instances, parameters, and subnet groups.
module "rds_grafana" {
  source                   	= "./modules/rds_grafana"
  app                      	= var.app
  env                      	= terraform.workspace
  master_username          	= var.grafana_master_username
  database_name            	= var.grafana_database_name
  engine                   	= var.grafana_engine
  engine_mode              	= var.grafana_engine_mode
  engine_version           	= var.grafana_engine_version
  db_subnet_ids            	= module.vpc.db_subnet_ids
  instance_class           	= lookup(var.grafana_instance_class, terraform.workspace)
  sg_rds_id                	= module.sg.sg_rds_id

  depends_on = [module.vpc, module.sg]
}Let’s also add a container registry module that uses ECR repositories to host and manage Docker images to enable containerization:
module "ecr" {
  source       	= "./modules/ecr"
  app          	= var.app
  env          	= terraform.workspace
  repository_names = var.repository_names
}The observability module is the core of our system. It ensures the correct integration of all of our tools in the infrastructure and manages container orchestration, service deployment, and the deployment of observability tools.
module "ecs" {
  source        	= "./modules/ecs"
  app           	= var.app
  env           	= terraform.workspace
  vpc_id        	= module.vpc.vpc_id
  aws_region    	= var.aws_region
  ecs_cluster_name  = var.ecs_cluster_name
  ecs_subnet_ids	= module.vpc.ecs_subnet_ids
  public_subnet_ids = module.vpc.public_subnet_ids

  lb_arn           	= module.lb_fargate.alb_arn
  http_port_loki   	= var.http_port_loki
  http_port_mimir  	= var.http_port_mimir
  http_port_grafana	= var.http_port_grafana
  certificate_arn  	= var.certificate_arn

  alb_dns_name = module.lb_fargate.alb_dns_name
  sg_lb_id 	= module.sg.sg_alb_id
  sg_ecs_id	= module.sg.sg_ecs_id
  sg_rds_id	= module.sg.sg_rds_id

  grafana_desired_count	= var.grafana_desired_count
  grafana_cpu_task     	= var.grafana_cpu_task
  grafana_cpu_container	= var.grafana_cpu_container
  grafana_memory_task  	= var.grafana_memory_task
  grafana_memory_container = var.grafana_memory_container
  grafana_port         	= var.grafana_port

  nginx_auth_desired_count	= var.nginx_auth_desired_count
  nginx_auth_cpu_task     	= var.nginx_auth_cpu_task
  nginx_auth_cpu_container	= var.nginx_auth_cpu_container
  nginx_auth_memory_task  	= var.nginx_auth_memory_task
  nginx_auth_memory_container = var.nginx_auth_memory_container
  http_port_nginx_auth    	= var.http_port_nginx_auth

  loki_desired_count	= var.loki_desired_count
  loki_cpu_task     	= var.loki_cpu_task
  loki_cpu_container	= var.loki_cpu_container
  loki_memory_task  	= var.loki_memory_task
  loki_memory_container = var.loki_memory_container
  loki_gossip_ring_port = var.loki_gossip_ring_port

  mimir_desired_count  = var.mimir_desired_count
  mimir_http_port   	= var.mimir_http_port
  mimir_grpc_port   	= var.mimir_grpc_port
  mimir_memberlist_port = var.mimir_memberlist_port

  mimir_cpu_task     	= var.mimir_cpu_task
  mimir_cpu_container	= var.mimir_cpu_container
  mimir_memory_task  	= var.mimir_memory_task
  mimir_memory_container = var.mimir_memory_container

  #GRAFANA
  grafana_db_endpoint   	= module.rds_grafana.aurora_cluster_endpoint
  grafana_database_type 	= var.grafana_database_type
  grafana_database_name 	= var.grafana_database_name
  grafana_database_user 	= var.grafana_master_username #grafana_database_user
  grafana_database_password = module.rds_grafana.grafana_admin_password
  depends_on	= [module.vpc, module.sg]
}Now that all of our code is ready, let’s start the deployment.
Read also
Automating Cloud Infrastructure Management for AWS Projects with Terraform
Boost efficiency and reduce errors in your cloud environment by implementing infrastructure automation. Discover key tools and strategies to keep your systems scalable and reliable.

2. Deploy observability tools as ECS services
Deploying observability tools as ECS services involves writing precise task definitions, orchestrating service dependencies, configuring container networking for seamless communication, and implementing robust security measures.
Task definitions
First, we need to create ECS task definitions for each of our observability tools so they correctly operate within the ECS cluster and interact with other services. Task definitions are blueprints that describe the containers required to run each service, including configurations such as Docker images, resource allocations, environment variables, and networking settings.
Loki task definition:
- Container image — Use the official Loki Docker image.
- Resources — Allocate appropriate CPU and memory resources based on the expected log volume.
- Environment variables — Configure Loki-specific settings, such as storage paths and ingestion configurations.
- Ports — Expose necessary ports for log ingestion and querying (e.g., port 3100).
resource "aws_ecs_task_definition" "loki" {
  family               	= join("-", [var.app, var.env, "loki"])
  cpu                  	= var.loki_cpu_task
  memory               	= var.loki_memory_task
  network_mode         	= "awsvpc"
  requires_compatibilities = ["FARGATE"]
  task_role_arn        	= aws_iam_role.loki_task_role.arn
  execution_role_arn   	= aws_iam_role.loki_ecs_execution_role.arn

  container_definitions = jsonencode([
	{
  	name       	= "loki"
  	container_name = "loki"
  	image      	= "grafana/loki:latest"
  	cpu      	= "${var.loki_cpu_container}"
  	memory   	= "${var.loki_memory_container}"
  	network_mode = "awsvpc"
  	essential	= true
  	command = [
    	"-config.file=/etc/loki/local-config.yaml"
  	]

  	mountPoints = [
    	{
      	sourceVolume  = "loki-config"
      	containerPath = "/etc/loki"
      	readOnly  	= false
    	}
  	]

  	logConfiguration = {
    	logDriver = "awslogs"
    	options = {
      	awslogs-group     	= "/ecs/loki"
      	awslogs-region    	= var.aws_region
      	awslogs-stream-prefix = "loki"
    	}
  	}
  	},
  	environment = [
    	{
      	name  = "S3_BUCKET_NAME"
      	value = "${aws_s3_bucket.loki_data.bucket}"
    	}
  	]
  	portMappings = [
    	{
      	containerPort = "${var.http_port_loki}"
      	name      	= "loki"
      	protocol  	= "tcp"
    	},
    	{
      	containerPort = "${var.loki_gossip_ring_port}"
      	name      	= "loki-gossip-ring"
      	protocol  	= "tcp"
    	}
  	]
	}
  ])
  volume {
	name = "loki-config"

	efs_volume_configuration {
  	file_system_id = aws_efs_file_system.loki.id
  	root_directory = "/config"
	}
  }
}Mimir task definition:
- Container image — Use the official Mimir Docker image.
- Resources — Allocate sufficient CPU and memory resources to handle high-volume metrics data.
- Environment variables — Set Mimir configurations, including backend storage details and retention policies.
- Ports — Expose ports required for metrics ingestion and querying (e.g., port 9009).
resource "aws_ecs_task_definition" "mimir" {
  family               	= join("-", [var.app, var.env, "mimir"])
  cpu                  	= var.mimir_cpu_task
  memory               	= var.mimir_memory_task
  network_mode         	= "awsvpc"
  requires_compatibilities = ["FARGATE"]
  task_role_arn        	= aws_iam_role.mimir_task_role.arn
  execution_role_arn   	= aws_iam_role.mimir_ecs_task_execution_role.arn

  container_definitions = jsonencode([
	{
  	name     	= "mimir"
  	image    	= ""grafana/mimir:latest"
  	cpu      	= "${var.mimir_cpu_container}"
  	memory   	= "${var.mimir_memory_container}"
  	network_mode = "awsvpc"
  	essential	= true
  	command = [
    	"-config.file=/etc/mimir.yaml",
    	"-server.grpc-listen-address=0.0.0.0",
    	"-server.http-listen-address=0.0.0.0",
  	]


  	"logConfiguration" = {
    	"logDriver" = "awslogs",
    	"options" = {
      	"awslogs-group"     	= "${aws_cloudwatch_log_group.mimir.name}",
      	"awslogs-region"    	= "${var.aws_region}",
      	"awslogs-stream-prefix" = "mimir"
    	}
  	},
  	environment = [
    	{
      	name  = "S3_BUCKET_NAME"
      	value = "${aws_s3_bucket.mimir_data.bucket}"
    	}
  	]
 	mountPoints = [
    	{
      	sourceVolume  = "mimir-config"
      	containerPath = "/etc/mimir"
      	readOnly  	= false
    	}
  	portMappings = [
    	{
      	containerPort = "${var.mimir_http_port}"
      	name      	= "mimir-http"
      	protocol  	= "tcp"
    	},
    	{
      	containerPort = "${var.mimir_grpc_port}"
      	name      	= "mimir-grpc"
      	protocol  	= "tcp"
    	},
    	{
      	containerPort = "${var.mimir_memberlist_port}"
      	name      	= "mimir-memberlist"
      	protocol  	= "tcp"
    	}
  	]
	}
  ])
  volume {
	name = "mimir-config"
	efs_volume_configuration {
  	file_system_id = aws_efs_file_system.mimir.id
  	root_directory = "/config"
	}
  }
}Grafana task definition:
- Container image — Deploy the official Grafana Docker image.
- Resources — Allocate adequate resources to support dashboard rendering and user interactions.
- Environment variables — Configure Grafana settings, such as data source connections to Loki and Mimir.
- Ports — Expose Grafana’s web interface port (e.g., port 3000).
resource "aws_ecs_task_definition" "grafana" {
  family               	= join("-", [var.app, var.env, "grafana22"])
  cpu                  	= var.grafana_cpu_task
  memory               	= var.grafana_memory_task
  network_mode         	= "awsvpc"
  requires_compatibilities = ["FARGATE"]
  task_role_arn        	= aws_iam_role.grafana_ecs_execution_role.arn
  execution_role_arn   	= aws_iam_role.grafana_ecs_execution_role.arn

  container_definitions = jsonencode([
	{
  	name = "grafana"
  	image    	= "grafana/grafana:latest"
  	cpu      	= "${var.grafana_cpu_container}"
  	memory   	= "${var.grafana_memory_container}"
  	network_mode = "awsvpc"
  	essential	= true
  	"logConfiguration" = {
    	"logDriver" = "awslogs",
    	"options" = {
      	"awslogs-group"     	= "${aws_cloudwatch_log_group.grafana.name}",
      	"awslogs-region"    	= "${var.aws_region}",
      	"awslogs-stream-prefix" = "grafana"
    	}
  	},
  	environment = [
    	{
      	name  = "GF_DATABASE_TYPE"
      	value = "${var.grafana_database_type}"
    	},
    	{
      	name  = "GF_DATABASE_HOST"
      	value = "${var.grafana_db_endpoint}"
    	},
    	{
      	name  = "GF_DATABASE_NAME"
      	value = "${var.grafana_database_name}"
    	},
    	{
      	name  = "GF_DATABASE_USER"
      	value = "${var.grafana_database_user}"
    	},
    	{
      	name  = "GF_DATABASE_PASSWORD"
      	value = "${var.grafana_database_password}"
    	},
    	{
      	name  = "GF_SERVER_ROOT_URL"
      	value = "https://${var.grafana_server_root_url}/app/grafana"
    	},
    	{
      	name  = "GF_SERVER_SERVE_FROM_SUB_PATH"
      	value = "true"
    	},
  	]
  	portMappings = [
    	{
      	containerPort = "${var.grafana_port}"
      	name      	= "grafana-http"
      	protocol  	= "tcp"
    	}
  	]
	}
  ])

}Nginx task definition:
- Container image — Use the official Nginx Docker image or a custom image with necessary configurations.
- Resources — Allocate resources based on expected traffic and authentication load.
- Environment variables — Configure Nginx settings for reverse proxy and authentication mechanisms.
- Ports — Expose ports for handling incoming HTTP/HTTPS requests (e.g., ports 80 and 443).
resource "aws_ecs_task_definition" "nginx_auth" {
  family               	= join("-", [var.app, var.env, "nginx-auth"])
  cpu                  	= var.nginx_auth_cpu_task
  memory               	= var.nginx_auth_memory_task
  network_mode         	= "awsvpc"
  requires_compatibilities = ["FARGATE"]
  task_role_arn        	= aws_iam_role.nginx_task_role.arn
  execution_role_arn   	= aws_iam_role.nginx_auth_ecs_execution_role.arn

  container_definitions = jsonencode([
	{
  	name       	= "nginx_auth"
  	container_name = "nginx_auth"
  	image      	= "nginx:latest"
  	cpu        	= "${var.nginx_auth_cpu_container}"
  	memory     	= "${var.nginx_auth_memory_container}"
  	network_mode   = "awsvpc"
  	essential  	= true

  	logConfiguration = {
    	"logDriver" = "awslogs",
    	"options" = {
      	"awslogs-group"     	= "${aws_cloudwatch_log_group.nginx_auth.name}",
      	"awslogs-region"    	= "${var.aws_region}",
      	"awslogs-stream-prefix" = "nginx_auth"
    	}
  	},
  	environment = [
    	{
      	name  = "S3_USERS_BUCKET"
      	value = "${aws_s3_bucket.nginx_users.bucket}"
    	}
    	{
      	name  = "NGINX_BACKEND_LOKI"
      	value = "loki.observability.local"
    	},
    	{
      	name  = "NGINX_BACKEND_MIMIR"
      	value = "mimir.observability.local"
    	}
  	]

  	mountPoints = [
    	{
      	sourceVolume  = "nginx-config"
      	containerPath = "/etc/nginx/conf.d"
      	readOnly  	= true
    	},
    	{
      	sourceVolume  = "nginx-ssl"
      	containerPath = "/etc/nginx/ssl"
      	readOnly  	= true
    	},
    	{
      	sourceVolume  = "nginx-auth"
      	containerPath = "/etc/nginx/auth"
      	readOnly  	= true
    	}
  	]
  	portMappings = [
    	{
      	containerPort = "${var.http_port_nginx_auth}"
      	name      	= "nginx_auth"
      	protocol  	= "tcp"
    	}
  	]
	}
  ])
  volumes = [
	{
  	name = "nginx-auth"
  	efsVolumeConfiguration = {
    	fileSystemId = aws_efs_file_system.nginx_auth.id
  	}
	}
  ]
}Now that all of our observability tools have allocated resources, configurations, and networking options, let’s ensure their continuous and independent work.
Service orchestration and container networking
Effective service orchestration and container networking ensure reliable startup sequences and facilitate seamless communication between services within the ECS cluster.
Here’s how we achieve this:
- Establish dependency management and startup sequences. With ECS placement strategies, we can ensure that dependent services are scheduled on appropriate instances with the necessary resources. The same AWS service provides health checks to monitor the status of each service. It also helps us manage the order of service startup and shutdown, preventing race conditions and ensuring that all components are available when needed.
- Service discovery and communication within the ECS Cluster. We should integrate ECS with AWS Cloud Map to enable dynamic service discovery. This allows services to discover and communicate with each other using DNS names without hardcoding IP addresses. To facilitate this communication, we use internal ALBs or NLBs. All of these services should be deployed within the same VPC and appropriate subnets.
- Container networking configuration. We use VPC networking mode to ensure that each container has its own elastic network interface. Then, we map container ports to host ports to avoid conflicts and ensure that services are accessible as intended. Lastly, we use ECS service discovery to resolve service endpoints dynamically, enabling containers to seamlessly locate and communicate with each other.
These three steps ensure continuous communication and data exchange among observability services. But we can’t exchange unprotected data, so let’s add security mechanisms.
Related project
Developing a Custom Secrets Management Desktop Application for Secure Password Sharing and Storage
Explore how we helped our client build a robust secrets management solution from the ground up, ensuring high-level data encryption, easy scalability, and integration with existing systems.

Security of observability data
Security is paramount when deploying observability tools, as they often handle sensitive data and provide critical insights into system operations. Implementing Nginx as a reverse proxy ensures that access to Loki and Mimir is secured, preventing unauthorized access and safeguarding data integrity.
To set up such an authentication mechanism, we’ll start by configuring Nginx to act as a reverse proxy that directs incoming requests to the appropriate service. This setup abstracts the internal service endpoints, providing a unified access point for clients. Then, we’ll enable SSL/TLS on Nginx to encrypt data in transit. This involves obtaining and installing SSL certificates and configuring Nginx to handle HTTPS requests. We should also enable Nginx’s load balancing capabilities to distribute incoming traffic evenly across multiple instances of Loki and Mimir.
To implement authentication features, we will set up basic authentication in Nginx by configuring username and password pairs. To enhance authentication, let’s configure Nginx to enforce rate limits and access control rules, mitigating potential abuse and ensuring that services remain resilient against excessive or malicious requests.
Now, we need to ensure data security in transit. We can enforce TLS encryption for all data transmitted between Nginx and backend services, preventing eavesdropping and man-in-the-middle attacks. We’ll also define strict security group rules for the firewall to allow only Nginx to communicate with Loki and Mimir.
Lastly, we should enable detailed access logging to monitor authentication attempts, track usage patterns, and identify potential security threats. To process this information more easily and receive notifications, we can visualize Nginx logs within Grafana.
Here’s how this configuration looks in the code:
upstream mimir_servers {
	server ${mimir1_url};
	server ${mimir2_url};
	server ${mimir3_url};
}

server {
	listen 443;
	server_name ${mimir_external_url};
	error_log /dev/stdout debug;

	# Configuration for Mimir
	location / {
    	auth_basic "Restricted Content";
    	auth_basic_user_file /etc/nginx/.htpasswd;
    	error_page 401 = @error401;
    	error_page 403 = @error403;
    	proxy_pass http://mimir_servers;
    	proxy_set_header Host $host;
    	proxy_set_header X-Real-IP $remote_addr;
    	proxy_set_header X-Forwarded-For $proxy_add_x_forwarded_for;
    	proxy_set_header X-Forwarded-Proto $scheme;
	}

	location /nginx-health {
    	# Health check endpoint
    	return 200 'OK';
    	add_header Content-Type text/plain;
	}

	location @error401 {
    	return 401 "Unauthorized";
	}
	location @error403 {
    	return 403 "Forbidden";
	}
}

# HTTPS Server Configuration for Loki
server {
	listen 443;
	server_name ${loki_external_url};

	# Configuration for Loki
	location / {
    	auth_basic "Restricted Content";
    	auth_basic_user_file /etc/nginx/.htpasswd;
    	error_page 401 = @error401;
    	error_page 403 = @error403;
    	proxy_pass http://${loki_url};
    	proxy_set_header Host $host;
    	proxy_set_header X-Real-IP $remote_addr;
    	proxy_set_header X-Forwarded-For $proxy_add_x_forwarded_for;
    	proxy_set_header X-Forwarded-Proto $scheme;
	}

	location /nginx-health {
    	# Health check endpoint
    	return 200 'OK';
    	add_header Content-Type text/plain;
	}

	location @error401 {
    	return 401 "Unauthorized";
	}
	location @error403 {
    	return 403 "Forbidden";
  }

}3. Integrate OpenTelemetry collectors
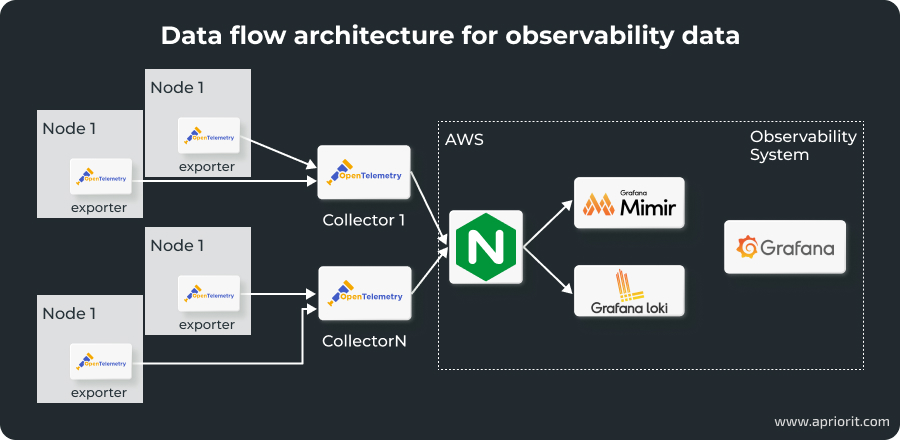
OpenTelemetry serves as a bridge between instrumentation libraries (exporters) and backend observability tools (collectors and storage systems). The telemetry data flows seamlessly from exporters to OpenTelemetry collectors and then to Mimir and Loki, with Nginx ensuring secure transmission. Integrating external OpenTelemetry collectors into the observability stack enhances the system’s ability to gather, process, and export telemetry data efficiently.
This integration includes:
- Exporters within applications to generate telemetry data
- Collectors that aggregate and process data from multiple exporters
- Nginx as a reverse proxy to authenticate and securely forward data
- Mimir and Loki, which store metrics and logs for visualization in Grafana
Here’s how the integration works:
To make sure this integration is efficient and secure, we should:
- Implement multiple collectors so that each one is tailored to specific data types
- Send data to Mimir and Loki via Nginx to ensure only authorized collectors can send data
- Enable SSL/TLS in Nginx to encrypt data in transit
Now that our observability data is collected and secured automatically, we can move to the last step — visualizing and using it.
Read also
How to Use Data Visualization and AI-Powered Knowledge Graphs to Enhance Your Cybersecurity Product
Discover how threat visualization techniques can improve cybersecurity monitoring and help your team detect complex attack patterns faster.

4. Visualize data and set up alerts with Grafana
To create data visualizations, let’s first add Loki and Mimir as data sources for Grafana.
In Grafana, go to Configuration > Data Sources and select Loki from the list of available data sources. We need to configure the URL to point to our Loki instance and provide authentication credentials. Then, click Save & Test to verify the connection. For Mimir integration, we should select Prometheus as the available data source and repeat the steps.
Next, let’s add metric panels for both tools by clicking Add Panel on our dashboard. First, we select Loki as a data source, filter and display relevant log entries with LogQL queries, and customize the visualization. Then, we select Prometheus as the data source for Mimir, add PromQL queries to retrieve and visualize metrics data, and configure the visualization. We can combine logs and metrics within the same dashboard to correlate events with performance data and use annotations to mark significant events or deployments within the dashboards.
All queries that fetch data can slow down the observability system, especially if it works in large-scale distributed software. That’s why it’s important to write optimized queries that reduce load times and improve dashboard responsiveness. For example, we can do this by using Grafana’s caching features to store frequently accessed data.
Now, we can design the alerting system — a vital component of an observability system that helps your team respond swiftly to potential issues before they escalate. Grafana offers robust alerting capabilities that can be configured based on metrics and log data from Loki and Mimir.
To use it, let’s go to Alerting > Alert Rules, select Loki or Mimir, and define conditions for alerts and how frequently Grafana should evaluate alert conditions. For example, let’s ask Grafana to check CPU use reported by Mimir every minute and alert us if it exceeds 80% for more than five minutes.
Grafana supports various notification channels, including email, Slack, PagerDuty, and Microsoft Teams. We can choose channels by going to Configuration > Notification channels and providing integration details like webhook URLs or API tokens. We can also customize alert messages, assign severity levels, and link created notification channels to specific alert rules to ensure that the appropriate teams are notified when an alert is triggered.
Such an alert system can become messy quickly, so we suggest implementing a naming system, creating alert groups, and regularly reviewing and adjusting alert rules. With Grafana’s alert history, we can track past alerts, analyze response effectiveness, and identify patterns or recurring issues. We also recommend adding alert status panels within Grafana dashboards for more efficient alert management.
To keep your alerts useful and manageable, make sure to document all alert rules, their purpose, configuration, and response procedures. Alerts should provide clear information and contain guidance on necessary steps. At the same time, check that only meaningful issues trigger notifications.
This is only part of building an effective observability stack, but you can use it as a blueprint for your software to improve visibility into its performance and infrastructure. It will not only enhance operational efficiency but also empower DevOps teams to proactively manage and optimize system performance, ensuring resilient and reliable infrastructure.
Conclusion
As software systems grow in scale and complexity, observability monitoring is no longer optional. It becomes necessary for any DevOps team tasked with maintaining product reliability and protecting business continuity. Building an observability stack equips your team with the visibility they need to detect, understand, and resolve issues quickly, even in highly distributed architectures.
By investing in observability early, you create a more resilient product and a development process that can adapt to change with confidence. In this article, we walked you through a practical implementation of an observability system using AWS, Terraform, and Grafana tools. This is only an example of the types of systems that Apriorit’s DevOps engineers build to help our clients improve their products right now and position them for the future.
When you come to us with a project, we carefully analyze the current state of your infrastructure, architectural capabilities and limitations, and business requirements. Based on this information, our skilled team will deliver an observability system that seamlessly integrates with your code.
Take your product to the next level!
Maximize performance and prepare your software for future growth by building a seamless, real-time, and insightful observability system with the help of Apriorit engineers.
Have a question?
Ask our expert!
VP of Innovation and Technology, Canada Branch Director


