



Key takeaways:
- Debugging the Linux kernel in a virtual environment provides a safe, controlled, and reproducible way to investigate kernel-level issues without affecting physical hardware or production systems.
- QEMU and Libvirt allow you to run and manage the target virtual machine, while GDB helps you inspect call stacks, variables, source code, and kernel execution in real time.
- Depending on the available artifacts, you can debug a kernel without source code with debug symbols only, connect symbols to the source code, or load symbols for custom and third-party modules.
- This approach helps detect kernel issues early in product development but comes with its own challenges.
Debugging the Linux kernel with QEMU and Libvirt provides a safer and more efficient alternative to traditional approaches. When diagnosing issues in the Linux kernel, traditional debugging approaches often require dedicated hardware, complex setups, or lengthy investigation cycles. Setting those up takes time and effort that development teams often don’t have.
In this article, we’ll show how you can create a reproducible virtual Linux environment for kernel debugging using QEMU, Libvirt, and GDB. Our step-by-step instructions will show you how to debug the Linux kernel and its modules during runtime. We review three debugging scenarios:
- Debugging without source code
- Debugging with source code
- Debugging third-party modules
This article will be useful for Linux kernel tech leaders who want their development teams to diagnose kernel-level issues faster.
Contents:
Setting up the environment
Before explaining how to debug the kernel, let’s prepare the necessary environment. Here’s what you need to install for debugging:
- QEMU as a hypervisor and emulator for hardware virtualization
- Libvirt as a daemon and a toolkit for managing platform virtualization
- GDB as a project debugger
- A QEMU virtual machine (VM)
For some debugging methods, you can also use Visual Studio Code.
Note: We’ll need two machines for debugging, as attaching the debugger to the kernel completely stops it. If we debug the kernel from inside the machine on which the kernel is running, it will lead to a deadlock where the debugger waits for the kernel and the kernel waits for the debugger.
In this guide, we’ll use Ubuntu 26.04 as the host OS with GDB debugger running inside it.
Our guest will be a Libvirt or QEMU-style virtual machine that runs Ubuntu 26.04 with the 7.0.0-15-generic kernel.
You can use other guest Linux distributions. Just make sure to install the corresponding packages beforehand. Now, let’s see how to debug Linux kernel elements if you don’t have access to the source code.
Need custom drivers to bring out the full potential of your product?
Reach out to our kernel and driver developers to improve your system’s stability, performance, and efficiency.
Debugging without source code
Debugging without the source code is the simplest way to quickly debug the kernel if you need to look at the call stack and variable values. You can verify the kernel image in this way:
1. Configure Libvirt on the host operating system with the following command:
virsh edit ubuntu26.04 Open the file with virtual machine settings in your editor of choice. Find the domain tag and add the following option:
<domain type='kvm'
        xmlns:qemu='http://libvirt.org/schemas/domain/qemu/1.0' >
 	<qemu:commandline>
      	<qemu:arg value='-s'/>
</qemu:commandline>Save the file, exit the editor, and restart the virtual machine if it’s already running.
The -s parameter means that QEMU will open port 1234 for debugging by default. If you need to open other ports, you can set them in the domain XML file:
<qemu:commandline>
    	<qemu:arg value='-gdb'/>
    	<qemu:arg value='tcp::1235'/>
</qemu:commandline> The specified port should open after the virtual machine starts.
2. Disable Kernel Address Space Layout Randomization (KASLR) on the guest VM. To do this, you need to apply changes directly to the GRand Unified Bootloader (GRUB) configuration. Open /etc/default/grub on the guest machine and add nokaslr to the GRUB_CMDLINE_LINUX_DEFAULT variable:
GRUB_CMDLINE_LINUX_DEFAULT="splash quiet nokaslr" 2. Update GRUB with the sudo update-grub command and reboot the guest OS.
The Linux kernel packages don’t include debug symbols, as they’re stripped from binary files at build time. However, you need to install debug symbols on the host machine to let GDB assist you during debugging. To install debug symbols for the existing kernel on the guest, see our detailed guide.
Here is how you can install debug symbols on Ubuntu:
1. Import GPG key:
gpg --keyserver keyserver.ubuntu.com --recv-keys C8CAB6595FDFF622 && gpg --export C8CAB6595FDFF622 | sudo gpg --dearmor -o /usr/share/keyrings/ubuntu-dbgsym.gpg2. Add the repository config:
codename=$(lsb_release -c | awk  '{print $2}')
sudo tee /etc/apt/sources.list.d/ddebs.list << EOF
deb [signed-by=/usr/share/keyrings/ubuntu-dbgsym.gpg] http://ddebs.ubuntu.com ${codename} main restricted universe multiverse
deb [signed-by=/usr/share/keyrings/ubuntu-dbgsym.gpg] http://ddebs.ubuntu.com ${codename}-updates main restricted universe multiverse
deb [signed-by=/usr/share/keyrings/ubuntu-dbgsym.gpg] http://ddebs.ubuntu.com ${codename}-proposed main restricted universe multiverse
EOF 3. Install the package with debug symbols:
sudo apt-get update
sudo apt-get install linux-image-$(uname -r)-dbgsym Note: If you want to install this package not on the debug target machine, use the exact version of the kernel to be debugged instead of $(uname -r).
You can manually download the deb package here and install it. Make sure to install a package with a compatible kernel and architecture.
Here’s how to install debug symbols on Fedora Linux:
sudo dnf debuginfo-instal kernel-$(uname -r)You can find a complete description of how to install debug symbols on Fedora Linux here.
4. Copy the /usr/lib/debug/boot/vmlinux-$(uname -r) file from the guest machine to any folder on the host machine so GDB can use it. In our case, we have the following file: /usr/lib/debug/boot/vmlinux-7.0.0-15-generic
5. Run the QEMU virtual machine on the host and connect it to the debugger:
gdb ./vmlinux-7.0.0-15-generic
(gdb) target remote :1234 After that, you can run debugging on your target machine. Here’s an example of Linux kernel debugging for Ubuntu 26.04 (7.0.0-15):
user@user-ubuntu-26:~$ gdb ./vmlinux-7.0.0-15-generic
GNU gdb (Ubuntu 17.1-2ubuntu1) 17.1
Copyright (C) 2025 Free Software Foundation, Inc.
License GPLv3+: GNU GPL version 3 or later <http://gnu.org/licenses/gpl.html>
This is free software: you are free to change and redistribute it.
There is NO WARRANTY, to the extent permitted by law.
Type "show copying" and "show warranty" for details.
This GDB was configured as "x86_64-linux-gnu".
Type "show configuration" for configuration details.
For bug reporting instructions, please see:
<https://www.gnu.org/software/gdb/bugs/>.
Find the GDB manual and other documentation resources online at:
<http://www.gnu.org/software/gdb/documentation/>.
For help, type "help".
Type "apropos word" to search for commands related to "word"...
Reading symbols from ./vmlinux-7.0.0-15-generic...
⚠️ warning: Section .debug_names in /home/user/vmlinux-7.0.0-15-generic length 137212 does not match section length 320908, ignoring .debug_names.
(gdb) target remote :1234
Remote debugging using :1234
Enable debuginfod for this session? (y or [n]) y
0xffffffff82718ebb in pv_native_safe_halt () at /build/linux-n6AAyw/linux-7.0.0/arch/x86/kernel/paravirt.c:63
This GDB supports auto-downloading debuginfo from the following URLs:
<https://debuginfod.ubuntu.com>
Debuginfod has been enabled.
To make this setting permanent, add 'set debuginfod enabled on' to .gdbinit.
⚠️ warning: 63 /build/linux-n6AAyw/linux-7.0.0/arch/x86/kernel/paravirt.c: No such file or directory
(gdb) bt
#0 0xffffffff82718ebb in pv_native_safe_halt () at /build/linux-n6AAyw/linux-7.0.0/arch/x86/kernel/paravirt.c:63
#1 0xffffffff8271b419 in arch_safe_halt () at /build/linux-n6AAyw/linux-7.0.0/arch/x86/include/asm/paravirt.h:73
#2 default_idle () at /build/linux-n6AAyw/linux-7.0.0/arch/x86/kernel/process.c:767
#3 0xffffffff8271b4e9 in arch_cpu_idle () at /build/linux-n6AAyw/linux-7.0.0/arch/x86/kernel/process.c:804
#4 0xffffffff8271b7df in default_idle_call () at /build/linux-n6AAyw/linux-7.0.0/kernel/sched/idle.c:122
#5 0xffffffff814d48f4 in cpuidle_idle_call (stop_tick=<optimized out>, stop_tick@entry=true) at /build/linux-n6AAyw/linux-7.0.0/kernel/sched/idle.c:199
#6 0xffffffff814d4a74 in do_idle () at /build/linux-n6AAyw/linux-7.0.0/kernel/sched/idle.c:352
#7 0xffffffff814d4ce9 in cpu_startup_entry (state=state@entry=237) at /build/linux-n6AAyw/linux-7.0.0/kernel/sched/idle.c:451
#8 0xffffffff8271c73f in rest_init () at /build/linux-n6AAyw/linux-7.0.0/init/main.c:760
#9 0xffffffff83f0ea34 in start_kernel () at /build/linux-n6AAyw/linux-7.0.0/init/main.c:1210
#10 0xffffffff83f23c64 in x86_64_start_reservations (real_mode_data=real_mode_data@entry=0x8a000 <error: Cannot access memory at address 0x8a000>) at /build/linux-n6AAyw/linux-7.0.0/arch/x86/kernel/head64.c:310
#11 0xffffffff83f23e04 in x86_64_start_kernel (real_mode_data=0x8a000 <error: Cannot access memory at address 0x8a000>) at /build/linux-n6AAyw/linux-7.0.0/arch/x86/kernel/head64.c:291
#12 0xffffffff8139b04d in secondary_startup_64 () at /build/linux-n6AAyw/linux-7.0.0/arch/x86/kernel/head_64.S:418
#13 0x000000841f0f2e66 in ?? ()
#14 0x00841f0f2e660000 in ?? ()
#15 0x1f0f2e6600000000 in ?? ()
#16 0x2e66000000000084 in ?? ()
#17 0x0000000000841f0f in ?? ()
#18 0x000000841f0f2e66 in ?? ()
#19 0x00841f0f2e660000 in ?? ()
#20 0x1f0f2e6600000000 in ?? ()
#21 0x2e66000000000084 in ?? ()
#22 0x0000000000841f0f in ?? ()
#23 0x000000841f0f2e66 in ?? ()
#24 0x00841f0f2e660000 in ?? ()
#25 0x1f0f2e6600000000 in ?? ()
#26 0x2e66000000000084 in ?? ()
#27 0x0000000000841f0f in ?? ()
#28 0x000000841f0f2e66 in ?? ()
#29 0x00841f0f2e660000 in ?? ()
#30 0x1f0f2e6600000000 in ?? ()
#31 0x2e66000000000084 in ?? ()
#32 0x0000000000841f0f in ?? ()
#33 0x000000841f0f2e66 in ?? ()
#34 0x00841f0f2e660000 in ?? ()
#35 0x00401f0f00000000 in ?? ()
#36 0x0000000000000000 in ?? ()
(gdb) break do_dentry_open
Breakpoint 1 at 0xffffffff818db790: file /build/linux-n6AAyw/linux-7.0.0/fs/open.c, line 889.
(gdb) c
Continuing.
Thread 1 hit Breakpoint 1, do_dentry_open (f=f@entry=0xffff8881009ff180, open=open@entry=0x0) at /build/linux-n6AAyw/linux-7.0.0/fs/open.c:889
⚠️ warning: 889 /build/linux-n6AAyw/linux-7.0.0/fs/open.c: No such file or directory
(gdb) print f->f_path.dentry->d_inode->i_ino
$1 = 393790 Related project
Developing Drivers for Low-latency Virtual Reality Headsets
See how we solved low-level Windows driver challenges for a VR product, helping the client accelerate development with virtual copies of the headset and bring a fully functional device to market.

Debugging with source code
Source code allows the debugger to associate events and circumstances in program execution with their corresponding location. So, using the source code, you can run the (gdb) list command without errors like “No such file or directory.”
If you have a source code file, make it available to GDB for kernel debugging in the following way:
1. Load the source code to the host (see detailed description here). You can read how to download the source code from the git repository here.
git clone https://git.launchpad.net/~ubuntu-kernel/ubuntu/+source/linux/+git/$(lsb_release -c | awk '{print $2}')
# find for kernel 7.0.0-15
git tag -l | grep 7.0.0-15
# Ubuntu-7.0.0-15.15
git checkout -b ubuntu-7.0.0-15.15 Ubuntu-7.0.0-15.152. Substitute the original source code path with the path to your source code using the set substitute-path command. In our case, the new path is /home/user/resolute.
gdb ./vmlinux-7.0.0-15-generic
(gdb) set substitute-path /build/linux-n6AAyw/linux-7.0.0 /home/user/resolute Note: The path /build/linux-n6AAyw/linux-7.0.0 n6AAyw contains a randomly generated folder name that was created during our package build process. The name of your folder may be different. To find it, use this command:
(gdb) info sources
/build/linux-n6AAyw/linux-7.0.0/init/main.c, /build/linux-n6AAyw/linux-7.0.0/include/linux/cpuset.h, /build/linux-n6AAyw/linux-7.0.0/arch/x86/include/asm/current.h, /build/linux-n6AAyw/linux-7.0.0/include/linux/sched/task.h, ...It will show you all the paths expected by the debugger.
Debugging with Visual Studio Code
If you use Visual Studio Code, you can debug the Linux kernel more conveniently in several steps:
1. Open the folder with kernel source code (in our case, it’s /home/user/resolute).
2. Add a new configuration:
{
"version": "0.2.0",
"configurations": [
{
"name": "Kernel Debug (QEMU)",
"type": "cppdbg",
"request": "launch",
"MIMode": "gdb",
"miDebuggerPath": "/usr/bin/gdb",
"program": "/home/user/vmlinux-7.0.0-15-generic",
"cwd": "${workspaceFolder}",
"stopAtEntry": false,
"externalConsole": false,
"setupCommands": [
{
"text": "set substitute-path /build/linux-n6AAyw/linux-7.0.0 ${workspaceFolder}"
}
],
"miDebuggerServerAddress": "localhost:1234"
}
]
} 3. Set a breakpoint where you want. Breakpoints make the debugger stop execution after a specified function or line number in the source file. For example, we can set one at fs/open.c:887 (do_dentry_open).
4. Run the configuration.
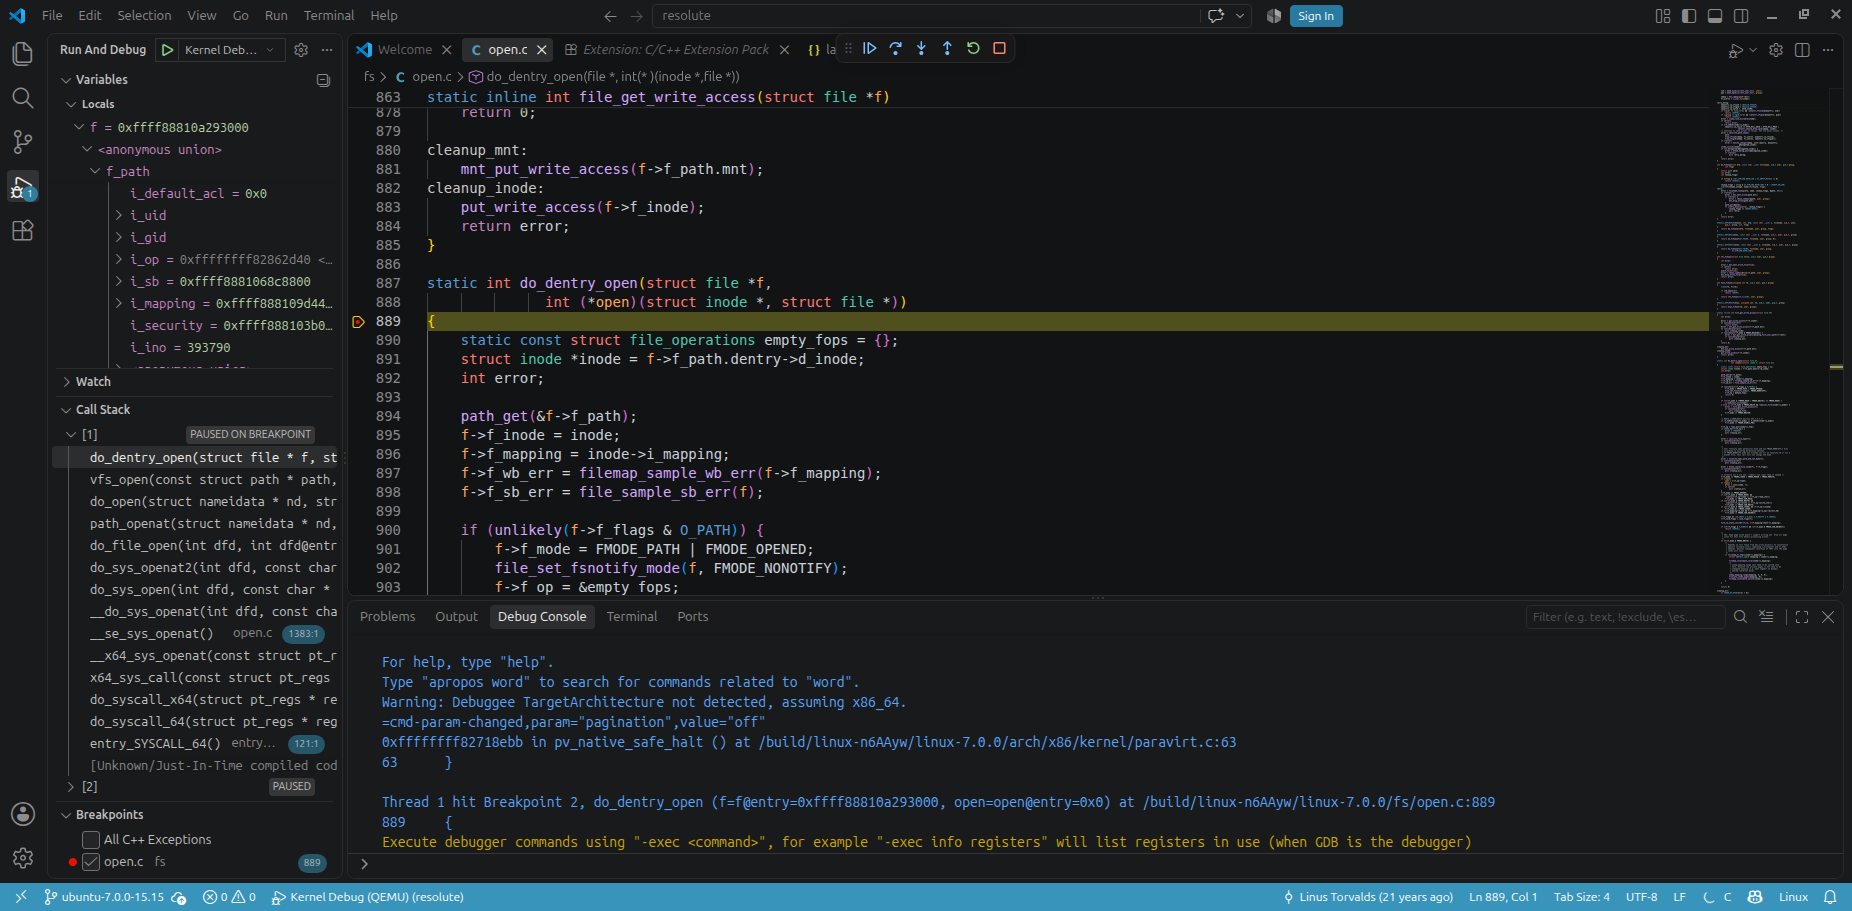
Now you can easily debug your kernel step by step, add breakpoints, investigate variables, and so on.
Read also
Linux Driver Development with Rust: Benefits, Challenges, and a Practical Example
Decide whether adopting Rust for Linux drivers makes business and technical sense. Review current capabilities, challenges, and practical implementation considerations.

Debugging third-party modules
This method is best suited for cases where you need to debug a module that’s not included in the official Linux kernel version. For instance, say you implemented a custom loadable kernel module and something went wrong, but you can’t find an error in the raw code.
Here’s how to debug the Linux kernel module:
1. Build the module with debug symbols and install it. To build the module with debug symbols, add the -g flag (EXTRA_CFLAGS += -g) to the compiler options.
2. Install the module on the VM.
3. Get the module load address to synchronize symbols with the source code:
cat /sys/module/mymodule/sections/.text 4. Start GDB:
gdb ./vmlinux-7.0.0-15-generic
(gdb) target remote :1234 5. Add the symbol file to your module:
(gdb) add-symbol-file <path to module.ko> <address from step 3> Here’s an example of debugging a custom kernel module:
user@user-ubuntu-26:~$ gdb ./vmlinux-7.0.0-15-generic
(gdb) target remote :1234
Remote debugging using :1234
(gdb) add-symbol-file /home/user/mymodule/mymodule.ko 0xffffffffc08b9000
add symbol table from file "/home/user/mymodule/mymodule.ko" at
.text_addr = 0xffffffffc08b9000
(y or n) y
Reading symbols from /home/user/mymodule/mymodule.ko...
(gdb) b value_store
Breakpoint 1 at 0xffffffff81dfbf90: value_store. (2 locations)
(gdb) c
Continuing.
[Switching to Thread 1.2]

Thread 2 hit Breakpoint 1.2, value_store (kobj=0xffffc900007ebca8, attr=0x10113fcc8,
    buf=0xffffffff8141a148 <__virt_addr_valid+152> "H\211\302e\377\005\336\336\377\002H\205\300tPH\213\bH\213u\370\366\301\002tD\203\341\b\270\001", count=18446612686368633128) at mymodule.c:28
28	{
(gdb) bt
#0  value_store (kobj=0xffffc900007ebca8, attr=0x10113fcc8, buf=0xffffffff8141a148 <__virt_addr_valid+152> "H\211\302e\377\005\336\336\377\002H\205\300tPH\213\bH\213u\370\366\301\002tD\203\341\b\270\001",
    count=18446612686368633128) at mymodule.c:28
#1  0xffffffff826db052 in kobj_attr_store (kobj=<optimized out>, attr=<optimized out>, buf=<optimized out>, count=<optimized out>) at /build/linux-n6AAyw/linux-7.0.0/lib/kobject.c:840
#2  0xffffffff819e03c4 in sysfs_kf_write (of=0xffff888100882e40, buf=0xffff88810113fcc8 "12\n", count=3, pos=<optimized out>) at /build/linux-n6AAyw/linux-7.0.0/fs/sysfs/file.c:142
#3  0xffffffff819ddf61 in kernfs_fop_write_iter (iocb=0xffffc900007ebd58, iter=<optimized out>) at /build/linux-n6AAyw/linux-7.0.0/fs/kernfs/file.c:352
#4  0xffffffff818e303b in new_sync_write (filp=0xffff888107e0f6c0, buf=0x58921743aad0 "12\n", len=<optimized out>, ppos=0xffffc900007ebdd0) at /build/linux-n6AAyw/linux-7.0.0/fs/read_write.c:595
#5  vfs_write (file=file@entry=0xffff888107e0f6c0, buf=buf@entry=0x58921743aad0 "12\n", count=count@entry=3, pos=pos@entry=0xffffc900007ebdd0) at /build/linux-n6AAyw/linux-7.0.0/fs/read_write.c:688
#6  0xffffffff818e3631 in ksys_write (fd=<optimized out>, buf=0x58921743aad0 "12\n", count=3) at /build/linux-n6AAyw/linux-7.0.0/fs/read_write.c:740
#7  0xffffffff818e36d9 in __do_sys_write (fd=<optimized out>, buf=<optimized out>, count=<optimized out>) at /build/linux-n6AAyw/linux-7.0.0/fs/read_write.c:751
#8  __se_sys_write (fd=<optimized out>, buf=<optimized out>, count=<optimized out>) at /build/linux-n6AAyw/linux-7.0.0/fs/read_write.c:748
#9  __x64_sys_write (regs=<optimized out>) at /build/linux-n6AAyw/linux-7.0.0/fs/read_write.c:748
#10 0xffffffff81345e2f in x64_sys_call (regs=regs@entry=0xffffc900007ebf48, nr=<optimized out>) at ./arch/x86/include/generated/asm/syscalls_64.h:2
#11 0xffffffff82710b75 in do_syscall_x64 (regs=0xffffc900007ebf48, nr=<optimized out>) at /build/linux-n6AAyw/linux-7.0.0/arch/x86/entry/syscall_64.c:63
#12 do_syscall_64 (regs=0xffffc900007ebf48, nr=<optimized out>) at /build/linux-n6AAyw/linux-7.0.0/arch/x86/entry/syscall_64.c:94
#13 0xffffffff8100012b in entry_SYSCALL_64 () at /build/linux-n6AAyw/linux-7.0.0/arch/x86/entry/entry_64.S:121
#14 0x000058921741f830 in ?? ()
#15 0x000058921743aad0 in ?? ()
#16 0x0000000000000003 in ?? ()
#17 0x0000000000000003 in ?? ()
#18 0x00007ffc488e7f80 in ?? ()
#19 0x0000784888613580 in ?? ()
#20 0x0000000000000202 in ?? ()
#21 0x0000000000000000 in ?? ()
(gdb) list
23	/* WRITE */
24	static ssize_t value_store(struct kobject *kobj,
25	                          struct kobj_attribute *attr,
26	                          const char *buf,
27	                          size_t count)
28	{
29	    int val;
30
31	    if (kstrtoint(buf, 10, &val) == 0) {
32 my_value = val;Debugging with Visual Studio Code
With Visual Studio Code, debugging your own module becomes more convenient. To do it, use the following configuration:
{
  "version": "0.2.0",
  "inputs": [
    {
      "id": "moduleLoadAddr",
      "type": "promptString",
      "description": "Enter module load address (hint: cat /sys/module/mymodule/sections/.text)",
    }
  ],
  "configurations": [
    {
      "name": “Module Debug",
      "type": "cppdbg",
      "request": "launch",

      "program": "/home/user/vmlinux-7.0.0-15-generic",

      "miDebuggerServerAddress": "localhost:1234",
      "miDebuggerPath": "/usr/bin/gdb",

      "cwd": "${workspaceFolder}",
      "stopAtEntry": false,
      "MIMode": "gdb",

      "setupCommands": [
        {
          "description": "Print hint",
          "text": "echo \\n[Hint] Get module address using: cat /sys/module/mymodule/sections/.text\\n"
        },
        {
          "description": "Load module symbols",
          "text": "add-symbol-file ${workspaceFolder}/mymodule.ko ${input:moduleLoadAddr}"
        }
      ]
    }
  ]
}When you run this configuration, Visual Studio Code will ask for the module load address. After it is successfully attached, you will be able to debug your module.
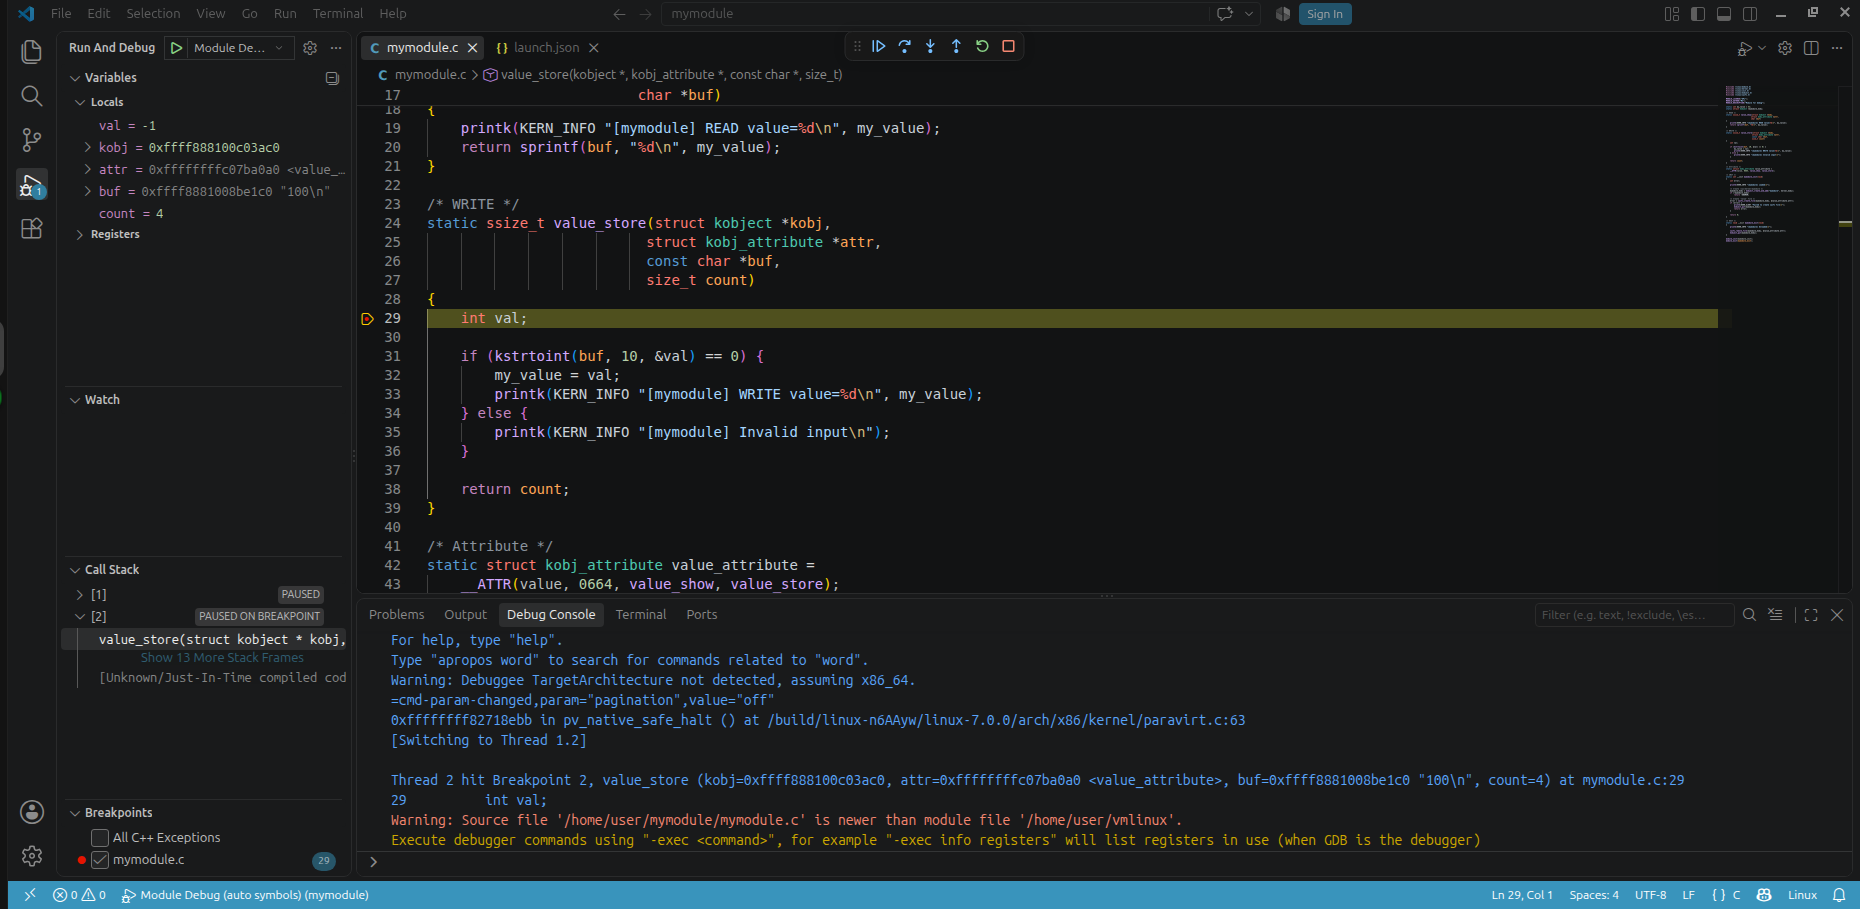
To simplify debugging, you can automate search for the module load address. Here’s how:
1. Install packages on the host machine:
sudo apt build-dep --yes linux-image-generic # Specify kernel version if guest kernel version is different from yours
sudo apt install --yes fakeroot libncurses-dev2. Now you need to build the GDB scripts on the host so you can debug the loaded modules. In the folder with kernel sources, run this command:
fakeroot debian/rules clean
make O=debian/build/build-generic oldconfig
make O=debian/build/build-generic scripts_gdb3. Allow the GDB to load, then create the ~/.gdbinit file as a user on the host:
echo add-auto-load-safe-path /home/user/resolute/debian/build/build-generic/vmlinux-gdb.py > ~/.gdbinit 4. The file with debug symbols should be named vmlinux to make our scripts runnable, so rename this file on the host:
mv vmlinux-7.0.0-15-generic vmlinux5. Run GDB and make sure that the scripts are alright. At this point, you can also check if it’s possible to set breakpoints in your module and debug it.
user@user-ubuntu-26:~$ gdb ./vmlinux
(gdb) source /home/user/resolute/debian/build/build-generic/vmlinux-gdb.py
(gdb) target remote :1234
Remote debugging using :1234
(gdb) lx-symbols
loading vmlinux
scanning for modules in /home/user
loading @0xffffffffc05c6000: /home/user/mymodule/mymodule.ko
no module object found for 'intel_rapl_msr'
no module object found for 'intel_rapl_common'
no module object found for 'intel_uncore_frequency_common'
...
no module object found for 'aesni_intel'
(gdb) break value_store
Breakpoint 1 at 0xffffffff81dfbf90: value_store. (2 locations)
(gdb) c
Continuing.

Thread 1 hit Breakpoint 1.2, value_store (kobj=0x10286, attr=0x10, buf=0xffffffffc05c61c0 <value_store> "\017\037D", count=18446744073709551615) at mymodule.c:28
28	{
(gdb) list
23	/* WRITE */
24	static ssize_t value_store(struct kobject *kobj,
25	                          struct kobj_attribute *attr,
26	                          const char *buf,
27	                          size_t count)
28	{
29	    int val;
30
31	    if (kstrtoint(buf, 10, &val) == 0) {
32 my_value = val; The line no module object found for means that there are no other modules that can be loaded. If the debugger can’t find source code files, you can manually add links to the source code for the modules. If any modules are available on the machine, you’ll see the following:
(gdb) lx-symbols
loading vmlinux
scanning for modules in /home/user
loading @0xffffffffc05c6000: /home/user/mymodule/mymodule.ko
loading @0xffffffffc05c5000: /home/user/resolute/debian/build/build-generic/drivers/powercap/intel_rapl_msr.ko
loading @0xffffffffc05c0000: /home/user/resolute/debian/build/build-generic/drivers/powercap/intel_rapl_common.ko
loading @0xffffffffc05be000: /home/user/resolute/debian/build/build-generic/drivers/platform/x86/intel/uncore-frequency/intel-uncore-frequency-common.ko
loading @0xffffffffc05b9000: /home/user/resolute/debian/build/build-generic/drivers/platform/x86/intel/pmc/intel_pmc_core.ko
loading @0xffffffffc05b7000: /home/user/resolute/debian/build/build-generic/drivers/platform/x86/intel/pmt/pmt_telemetry.ko
loading @0xffffffffc05b8000: /home/user/resolute/debian/build/build-generic/drivers/platform/x86/intel/pmt/pmt_discovery.ko
loading @0xffffffffc05b6000: /home/user/resolute/debian/build/build-generic/drivers/platform/x86/intel/pmt/pmt_class.ko
loading @0xffffffffc05b1000: /home/user/resolute/debian/build/build-generic/drivers/platform/x86/intel/pmc/intel_pmc_ssram_telemetry.ko
loading @0xffffffffc05b4000: /home/user/resolute/debian/build/build-generic/drivers/platform/x86/intel/intel-vsec.ko
loading @0xffffffffc08a8000: /home/user/resolute/debian/build/build-generic/arch/x86/kvm/kvm-intel.ko
loading @0xffffffffc0800000: /home/user/resolute/debian/build/build-generic/net/wireless/cfg80211.ko
loading @0xffffffffc05b2000: /home/user/resolute/debian/build/build-generic/fs/binfmt_misc.ko
loading @0xffffffffc050a000: /home/user/resolute/debian/build/build-generic/arch/x86/kvm/kvm.ko
loading @0xffffffffc0509000: /home/user/resolute/debian/build/build-generic/virt/lib/irqbypass.ko
loading @0xffffffffc0508000: /home/user/resolute/debian/build/build-generic/arch/x86/events/rapl.ko
loading @0xffffffffc04f7000: /home/user/resolute/debian/build/build-generic/sound/hda/codecs/snd-hda-codec-generic.ko
loading @0xffffffffc04f2000: /home/user/resolute/debian/build/build-generic/sound/hda/controllers/snd-hda-intel.ko
loading @0xffffffffc04dc000: /home/user/resolute/debian/build/build-generic/sound/hda/common/snd-hda-codec.ko
loading @0xffffffffc04cf000: /home/user/resolute/debian/build/build-generic/sound/hda/core/snd-hda-core.ko
loading @0xffffffffc04cd000: /home/user/resolute/debian/build/build-generic/sound/hda/core/snd-intel-dspcfg.ko
loading @0xffffffffc0484000: /home/user/resolute/debian/build/build-generic/sound/hda/core/snd-intel-sdw-acpi.ko
loading @0xffffffffc04cb000: /home/user/resolute/debian/build/build-generic/sound/core/snd-hwdep.ko
loading @0xffffffffc04b2000: /home/user/resolute/debian/build/build-generic/sound/core/snd-pcm.ko
loading @0xffffffffc04ac000: /home/user/resolute/debian/build/build-generic/sound/core/snd-timer.ko
loading @0xffffffffc04a9000: /home/user/resolute/debian/build/build-generic/drivers/i2c/busses/i2c-i801.ko
loading @0xffffffffc049a000: /home/user/resolute/debian/build/build-generic/sound/core/snd.ko
loading @0xffffffffc048b000: /home/user/resolute/debian/build/build-generic/drivers/i2c/i2c-smbus.ko
loading @0xffffffffc0488000: /home/user/resolute/debian/build/build-generic/sound/soundcore.ko
loading @0xffffffffc048d000: /home/user/resolute/debian/build/build-generic/drivers/gpu/drm/virtio/virtio-gpu.ko
loading @0xffffffffc048c000: /home/user/resolute/debian/build/build-generic/drivers/i2c/i2c-mux.ko
loading @0xffffffffc0489000: /home/user/resolute/debian/build/build-generic/drivers/mfd/lpc_ich.ko
loading @0xffffffffc0485000: /home/user/resolute/debian/build/build-generic/drivers/input/joydev.ko
loading @0xffffffffc0483000: /home/user/resolute/debian/build/build-generic/drivers/input/input-leds.ko
loading @0xffffffffc0481000: /home/user/resolute/debian/build/build-generic/drivers/macintosh/mac_hid.ko
loading @0xffffffffc0482000: /home/user/resolute/debian/build/build-generic/drivers/virtio/virtio_dma_buf.ko 6. If you want to check other modules, you can add links to the source code for them in the same way as we did in the first step:
(gdb) set substitute-path <files which debugger tries to find> <their real path> Since we managed to automate getting the module load address, our configuration for Visual Studio Code now looks like this:
{
  "version": "0.2.0",
  "configurations": [
    {
      "name": "Module Debug (auto symbols)",
      "type": "cppdbg",
      "request": "launch",

      "program": "/home/user/vmlinux",

      "miDebuggerServerAddress": "localhost:1234",
      "miDebuggerPath": "/usr/bin/gdb",

      "cwd": "${workspaceFolder}",
      "stopAtEntry": false,
      "MIMode": "gdb",

      "setupCommands": [
        {
          "description": "Allow GDB to auto-load kernel debugging scripts",
          "text": "add-auto-load-safe-path /home/user/resolute/debian/build/build-generic/vmlinux-gdb.py"
        },
      ],
      "postRemoteConnectCommands": [
        {
          "description": "Load kernel GDB helpers",
          "text": "source /home/user/resolute/debian/build/build-generic/vmlinux-gdb.py"
        },
        {
          "description": "Auto-load all module symbols",
          "text": "lx-symbols"
        }
      ]
    }
  ]
}This configuration will immediately start the debugger without any user input.
Read also
Hooking Linux Kernel Functions: A Comprehensive Guide for the Ftrace Framework
Evaluate the safest approach to modifying kernel behavior. Learn when function hooking is appropriate, what challenges to expect, and how to minimize operational risks.

How Apriorit can help your team with kernel debugging
Debugging Linux kernel images or modules is a complex task that many developers face. In our Linux development projects, we often use virtualization tools like QEMU and Libvirt to detect and fix defects at the development stage. This approach allows us to be proactive and save time on late-stage fixing.
Apriorit brings over 20 years of software engineering experience and focused expertise in Linux, kernel, and driver development. We have delivered real-life projects, shared our knowledge in driver development tutorials, and held practical webinars on Linux development.
Our team will help you with:
- Kernel-level development to build reliable low-level components tailored to your product’s performance, security, and stability needs.
- Linux kernel debugging to help you quickly uncover root causes of complex kernel issues. We work both with real hardware and virtual machines to help you detect kernel issues early and offer ways to fix them.
- Driver stabilization to fix reliability, compatibility, and performance issues of your existing Linux driver. Our team will find a way to improve your code and make your driver production-ready.
- Support and maintenance to keep your kernel-level software stable, secure, and compatible as systems evolve.
Looking for a dedicated kernel development team?
Apriorit’s team will develop a new kernel-level solution from scratch or stabilize and improve your legacy kernel modules.
FAQ
What is Linux kernel debugging?
<p>Linux kernel debugging is the process of examining and troubleshooting issues within the Linux kernel.</p>
<p>Unlike application debugging, kernel debugging operates at the OS level, where bugs can cause system crashes, kernel panics, performance degradation, or hardware communication failures.</p>
<p>Effective kernel debugging helps teams identify the root causes of complex issues and validate fixes before deploying them to production systems.</p>
What are QEMU and Libvirt used for?
<p>In debugging, QEMU and Libvirt are widely used tools for creating and managing virtualized environments.</p>
<p>QEMU is an open-source machine emulator and virtualization tool that can run complete operating systems in virtual machines. It allows developers to simulate hardware, boot custom kernels, and connect debugging tools such as GDB directly to a virtualized system.</p>
<p>Libvirt is a virtualization management framework that simplifies the creation, configuration, and administration of virtual machines. It provides a consistent interface for managing QEMU and other virtualization platforms.</p>
What are the benefits of debugging the Linux kernel in a virtual machine?
<p>Debugging the Linux kernel in a virtual machine provides a controlled and repeatable environment that simplifies troubleshooting and accelerates development.</p>
<p>Key benefits include:</p>
<ul>
<li>Safe testing without affecting physical hardware or production systems.</li>
<li>Faster environment setup and recovery through snapshots and cloning.</li>
<li>Direct integration with debuggers such as GDB.</li>
<li>Support for automated testing and continuous integration workflows.</li>
</ul>
What are the limitations of kernel debugging in a virtual machine?
<p>Compared to debugging with physical hardware, limitations of a virtual approach include:</p>
<ul>
<li>Inaccurate reproduction of hardware-specific issues in some cases.</li>
<li>Challenging investigation of device driver bugs that involve specialized peripherals.</li>
<li>Differences in performance characteristics compared to real-world deployments.</li>
<li>Timing-sensitive race conditions can behave differently under virtualization.</li>
</ul>
<p>To manage these limitations, development teams often use VMs for initial analysis and validation, then verify fixes on real target hardware.</p>
Can I use Visual Studio Code for Linux kernel debugging?
<p>Yes. Visual Studio Code can be used as a front end for Linux kernel debugging when combined with GDB and a virtualized environment such as QEMU.</p>
What are Linux kernel debug symbols?
<p>Linux kernel debug symbols are additional metadata generated during the kernel build process that map compiled machine code back to source code functions, variables, data structures, and file locations. They help debugging tools to display meaningful information instead of raw memory addresses.</p>
Have a question?
Ask our expert!

Program Manager