 Skip to main content

Key takeaways:
- Hooking Linux functions helps with tracing different processes in the system and blocking suspicious activity, which is especially useful for XDR, SIEM, and DLP systems.
- Though the Linux ftrace framework wasn’t created for function hooking, Apriorit developers have discovered a way to successfully use it for this purpose.
- Prior to hooking a Linux function using ftrace, you need to describe the function and initialize ftrace. Once the function is hooked, it’s crucial to protect the ftrace hook wrapper from recursive calls.
- To protect functions from ftrace-based hooking, consider modifying ftrace structures by deleting all the information about module functions that’s stored in the records and structures of the ftrace framework.
Function hooking is essential for extended detection and response (XDR), security information and event management (SIEM), and data loss prevention (DLP) systems to track and block suspicious processes.
But how can you hook Linux kernel functions?
Below, we suggest several approaches and describe our own ftrace method, which we see as the most promising.
This comprehensive guide describes our unique experience researching, testing, and successfully implementing an ftrace-based approach to hooking Linux kernel functions. We also show how to protect your systems from unwanted hooking.
If you’re a development or product leader looking for solutions to efficiently hook kernel functions for security purposes, this article will be helpful.
Contents:
- 4 ways to hook functions in Linux
- Using Linux ftrace framework for function hooking
- The scheme of the hooking process
- How to hook Linux kernel functions using ftrace
- 1. Describe necessary functions
- 2. Initialize ftrace
- 3. Hook functions using ftrace
- 4. Protect the ftrace hook wrapper from recursive calls
- Unexpected nuances of working with ftrace
- Practical examples on protecting your Linux kernel module from ftrace hooks
- Deliver successful and secure Linux projects with Apriorit
- Conclusion
4 ways to hook functions in Linux
We’d been working on a security-related project that required us to hook Linux kernel function calls for opening files, launching processes, and more.
Our team was looking for a way to enable system activity monitoring and preemptively block suspicious processes. Thus, we started the project with thorough research and analysis of existing methods to hook Linux kernel functions.
Michael, Program Manager at Apriorit
We started our research with four existing methods to intercept critical functions of the Linux kernel one by one. Below, we outline all of those options, along with their pros and cons.
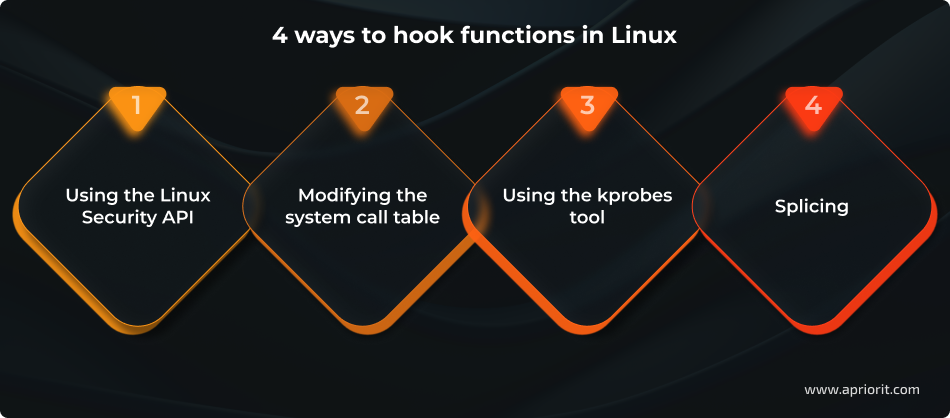
1. Using the Linux Security API
While this approach might seem the most straightforward since the Linux Security API interface is designed for this particular purpose, it still has some drawbacks.
Pros:
- Kernel-level security hooks. Critical points of the kernel code contain security function calls that can cause callbacks installed by the security module.
- Context-aware decisions. The security module can study the context of a specific operation and decide whether to permit or prohibit it.
Cons:
- No dynamic loading. Security modules can’t be loaded dynamically, so your team needs to rebuild the kernel to include new modules.
- Single-module limitation. With some minor exceptions, a system can’t have multiple security modules.
- Custom kernel requirement. To use the Linux Security API, your team needs to build a custom Linux kernel and integrate an additional module using AppArmor or SELinux, which might take too much time.
2. Modifying the system call table
Since all Linux system call handlers are stored in sys_call_table, changing the values in this table changes the system behavior. Thus, you can hook any system call by saving the old handler value and adding your own handler to the table.
Pros:
- Full control over all system calls. Because system calls are the sole interface between user applications and the kernel, modifying the system call table gives you complete control over all system calls. This way, you won’t miss any important actions performed by a user process.
- Minimal performance overhead. This approach only requires a one-time investment in updating the system call table. The two other costs are the inevitable monitoring payload and the extra system call handler.
- Minimal kernel requirements. You can use this approach for nearly any system, as you don’t need specific kernel features in order to modify the system call table.
Cons:
- Technical complexity. While replacing values in the table isn’t difficult, finding the system call table, bypassing kernel write protection of the table’s memory region, and ensuring safe performance of the replacement process may present a challenge.
- Some handlers can’t be replaced. In Linux kernels prior to version 4.16, system call processing for the x86_64 architecture has optimizations that require the system call handler to be implemented in the assembler. These kinds of handlers are either hard or impossible to replace with custom handlers written in C. Furthermore, it’s challenging to manage different kernel versions with different optimization boosts within one project.
- Only system calls can be hooked. Since this approach allows you to replace system call handlers, it limits entry points significantly. All additional checks can be performed either immediately before or after a system call, and we only have system call arguments and their return values. As a result, we may need to double-check access permissions of the process and the validity of system call arguments, as well as copy user process memory twice.
3. Using the kprobes tool
Kprobes is a specific API designed for Linux kernel tracing and debugging. It allows you to install pre-handlers and post-handlers for any kernel instruction as well as for function-entry and function-return handlers. Handlers get access to registers and can alter them. This way, we can both monitor the work process and alter it.
Pros:
- Mature API. Since kprobes has been constantly improving since 2002, this utility has a well-documented interface and the majority of pitfalls have already been discovered and dealt with.
- Possibility to trace any point in the kernel. Kprobes is implemented via breakpoints (the int3 instruction) embedded in the executable kernel code. Thus, you can set the trace point in any part of any function as long as you know its location. You can also implement kretprobes by switching the return address on the stack and trace any function’s return (except for functions that don’t return control at all).
Cons:
- Technical complexity. To get function arguments or local variable values, you need to know exactly where they’re located on the stack (and in which registers) and extract them manually. Also, to block a function call, you need to manually modify the state of the process so you can trick it into thinking that it’s already returned control from the function.
- Technical overhead. Even though it’s a one-time procedure, positioning breakpoints is quite costly. While breakpoints don’t affect the rest of the functions, processing them requires significant effort. Fortunately, the costs of using kprobes can be reduced significantly by using a jump-optimization implemented for the x86_64 architecture. Still, the cost of using kprobes surpasses that of modifying the system call table.
- Handler restrictions. Kprobes is based on interruptions and fiddles with processor registers. To maintain consistent CPU state while probing instructions, kprobes handlers must run with preemption disabled. This ensures that no other task or interrupt can modify processor registers during handler execution.
4. Splicing
A classic way to configure kernel function hooking is by replacing the instructions at the beginning of a function with an unconditional jump leading to your handler. The original instructions are moved to a different location and are executed right before jumping back to the intercepted function. Thus, with the help of only two jumps, you can splice your code into a function.
Pros:
- Minimal kernel requirements. Splicing doesn’t require any specific kernel options and can be implemented at the beginning of any function. All you need is the function’s address.
- Minimal overhead costs. The traced code needs to perform only two unconditional jumps to hand over control to the handler and get control back. These jumps are easy to predict for the processor and are quite inexpensive.
Cons:
The biggest drawback of splicing is the technical complexity. Replacing the machine code in a function isn’t that easy. Here are only a few of the things you need to accomplish in order to use splicing:
- Synchronize hook installation and removal (in case the function is called during instruction replacement)
- Bypass the write protection of memory regions with executable code
- Invalidate CPU caches after instructions are replaced
- Disassemble replaced instructions in order to copy them as a whole
- Check that there are no jumps in the replaced part of the function
- Check that the replaced part of the function can be moved to a different place
Unfortunately, none of those options was good enough for the project we were working on. So, the Apriorit team decided to try a new approach using the ftrace framework.
Alexey, Senior Developer at Apriorit
Need experts in Linux kernel development?
Accelerate your product with engineers experienced in building, optimizing, and integrating Linux kernel modules and drivers tailored to your hardware needs.
Using the Linux ftrace framework for function hooking
When we were researching the topic of Linux function hooking, our attention was drawn to Linux ftrace, a framework you can use to trace Linux kernel function calls. While performing Linux kernel tracing with ftrace is common practice, this framework also can be used as an alternative to jprobes.
Serhii, Senior Developer at Apriorit
Ftrace is a Linux kernel framework for tracing Linux kernel functions. Our team managed to find a new way to use ftrace to enable system activity monitoring and block suspicious processes. Ftrace makes hooking Linux kernel functions much easier and has several crucial advantages.
Pros:
- Mature API and simple code. Leveraging ready-to-use interfaces in the kernel significantly reduces code complexity. You can hook your kernel functions with ftrace by making only a couple of function calls, filling in two structure fields, and adding a bit of magic in the callback. The rest of the code is just business logic executed around the traced function.
- Ability to trace any function by name. Linux kernel tracing with ftrace is quite a simple process. Writing the function name in a regular string is enough to point to the function you need. You don’t have to struggle with the linker, scan the memory, or investigate internal kernel data structures. As long as you know their names, you can trace kernel functions with ftrace even if those functions aren’t exported for modules.
- Low overhead costs. You need to perform only several comparisons and subtractions without grabbing any spinlocks or iterating through lists.
- Hooking doesn’t have to be global. Since there’s no synchronization, this approach is compatible with preemption and isn’t tied to the global process list. As a result, you can trace even interrupt handlers.
- There are no limitations for functions. This approach supports any number of trace function activations (including recursive) out of the box. During recursive calls, the return address is still located outside of our module, so the callback test works correctly.
Cons:
- Kernel configuration requirements. There are several kernel requirements to ensure successful ftrace Linux kernel tracing: the list of kallsyms symbols for searching functions by name, the ftrace framework as a whole for performing tracing, and ftrace options that are crucial for hooking functions.
- Overhead costs. Since ftrace doesn’t use breakpoints, it has lower overhead costs than kprobes (as mentioned above). However, the overhead costs are higher than for splicing manually. In fact, dynamic ftrace is a variation of splicing that executes the unneeded ftrace code and other callbacks.
- Functions are wrapped as a whole. As with usual splicing, ftrace wraps functions as a whole. And while splicing technically can be executed in any part of the function, ftrace works only at the entry point. This may be a disadvantage in rare cases, but usually it doesn’t cause any complications.
- Double ftrace calls. Using the
parent_ippointer for analysis leads to calling ftrace twice for the same hooked function. This adds some overhead costs and can disrupt the readings of other traces because they’ll see twice as many calls. You can fix this issue by moving the original function address five bytes further (the length of the call instruction), essentially allowing you to spring over ftrace.
In the next section, we look closer at the hooking process and describe how ftrace works in more detail.
Read also
Linux Driver Development with Rust: Benefits, Challenges, and a Practical Example
Improve the safety and reliability of your Linux drivers by exploring how Rust strengthens memory management and prevents critical failures in kernel development.

Scheme of the hooking process
Eventually, we invented an efficient approach for hooking any function in the kernel by its name and executing our code around its calls with the help of ftrace, a Linux kernel tracing framework.
For our project, the ftrace approach appeared to be the most suitable. It turned out that ftrace allows you to install hooks from a loadable GPL module without rebuilding the kernel. This approach works for Linux kernel versions 3.19 and newer for the x86_64 architecture.
Andrii, Chief Information Security Officer at Apriorit
So, how does ftrace work? Let’s take a look at a simple example:
- You’ve typed the command
lsin the terminal to see the list of files in the current directory. - The command-line interpreter (say, Bash) launches a new process using
fork()andexecve()functions from the standard C library. - Inside the system, these functions are implemented through system calls:
clone()andexecve(), respectively. - Now you want to hook the
execve()system call to gain control over launching new processes.
The image below illustrates how to use ftrace to hook a handler function.
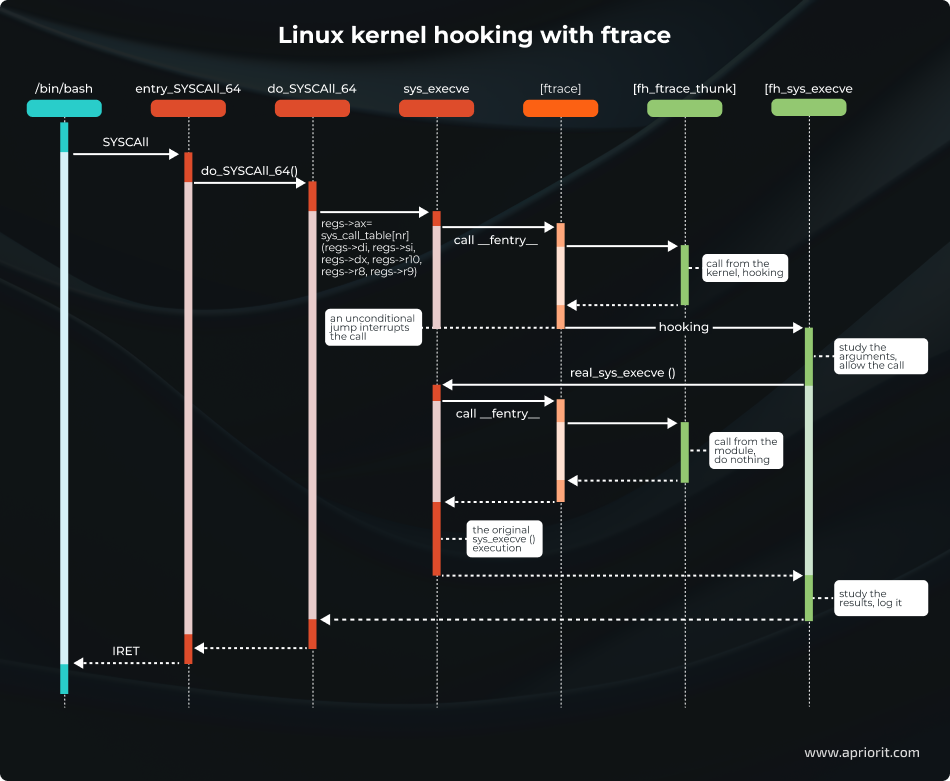
In this image, we can see how a user process (blue) executes a system call to the kernel (red) where the ftrace framework (orange) calls functions from our module (green).
Let’s describe each step in detail:
- The
SYSCALLinstruction is executed by the user process. This instruction allows for switching to the kernel mode and putting the low-level system call handlerentry_SYSCALL_64()in charge. This handler is responsible for all system calls of 64-bit programs on 64-bit kernels. - A specific handler receives control. The kernel quickly accomplishes all low-level tasks implemented on the assembler and hands over control to the high-level
do_syscall_64 ()function, which is written in C. This function reaches the system call handler tablesys_call_tableand calls a particular handler by the system call number. In our case, it’s thesys_execve ()function. - Calling ftrace. Every kernel function starts with
an __fentry__()function call. This call is implemented by the ftrace framework. In functions that don’t need to be traced, this call is replaced with the NOP instruction. However, in the case of thesys_execve()function, there’s no such call. - Ftrace calls all registered trace callbacks, including ours. Other callbacks won’t interfere, since only one callback can be installed that changes the value of the
%ripregister. - The callback performs the hooking. The callback looks at the value of
parent_ipleading inside thedo_syscall_64()function (since it’s the particular function that called thesys_execve()handler) and decides to hook the function, changing the values of the%ripregister in thept_regsstructure. - Ftrace restores the state of the registers. Following the
FTRACE_SAVE_REGSflag, the framework saves the register state in thept_regsstructure before it calls the handlers. Once handling is over, the registers are restored from the same structure. Our handler changes the%ripregister (a pointer to the next executed function), which leads to passing control to a new address. - The wrapper function receives control. An unconditional jump makes it look like activation of the
sys_execve()function has been terminated. Instead, control goes to our function:fh_sys_execve(). Meanwhile, the state of both processor and memory remains the same, so our function receives the arguments of the original handler and returns control to thedo_syscall_64()function. - The wrapper calls the original function. Now, the system call is under our control. After analyzing the context and arguments of the system call, the
fh_sys_execve()function can either allow or deny execution. If execution is denied, the function returns an error code. Otherwise, the function needs to repeat the call to the original handler andsys_execve()is called again through thereal_sys_execvepointer that was saved during the hook setup. - The callback gets control. Just like during the first call of
sys_execve(), control goes through ftrace to our callback. But this time, the process ends differently. - The callback does nothing. The
sys_execve()function was called not by the kernel fromdo_syscall_64()but by ourfh_sys_execve()function. Therefore, the registers remain unchanged and thesys_execve()function is executed as usual. The only problem is that ftrace sees the entry tosys_execve()twice. - The wrapper gets back control. The system call handler
sys_execve()gives control to ourfh_sys_execve()function for the second time. Now, the launch of a new process is nearly finished. We can see if theexecve()call finished with an error, study the new process, make some notes in the log file, and so on. - The kernel receives control. Finally, the
fh_sys_execve()function is finished and control returns to thedo_syscall_64()function. This function sees the call as having been completed normally, and the kernel proceeds as usual. - Control goes to the user process. In the end, the kernel executes the
IRETinstruction, installing the registers for a new user process and switching the processor into user code execution mode. The system call is over, and so is the launch of the new process.
With this general workflow in mind, let’s dive deeper into how ftrace works and showcase an example of using it for Linux kernel hooking.
Watch webinar
SELinux: Basics and Practical Sandboxing with Type Enforcement
Discover expert insights on leveraging SELinux for building high-security environments and protecting your system from cybersecurity threats.
How to hook Linux kernel functions using ftrace
The ftrace implementation is based on these two compiler options:
-pg-mfentry
These options insert a call to a tracing function at the beginning of every function: mcount() or __fentry__().
In user programs, profilers use this compiler capability for tracking calls to all functions. In the kernel, however, developers use these functions to implement the ftrace framework.
Calling ftrace from every function is rather costly, as it introduces additional overhead for each function call, significantly slowing down execution. This is why there’s an optimization available for popular architectures: dynamic ftrace.
If ftrace isn’t in use, it nearly doesn’t affect the system because the kernel knows where mcount() or __fentry__() are located. The kernel also replaces the machine code with nop (a specific instruction that does nothing) at an early stage. And when Linux kernel trace is on, ftrace calls are added back to the necessary functions.
Now, let’s move to hooking Linux functions with ftrace in four steps:
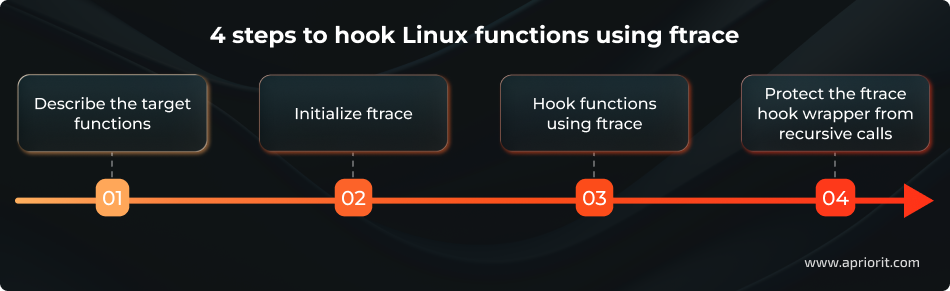
1. Describe the target functions
Here’s the structure we suggest to describe each function that will be hooked:
struct ftrace_hook {
        const char *name;
        void *function;
        void *original;

        unsigned long address;
        struct ftrace_ops ops;
};
struct ftrace_hookー a structure that describes the function to be hooked*nameー the name of the function to be hooked*functionー the address of the wrapper function that will be called instead of the hooked function*originalー a pointer to the place where the address of the hooked function should be stored, provided during installation of the hook*addressー the address of the hooked function, provided during installation of the hook*opsー ftrace service information, initialized by zeros; initialization is finished during installation of the hook
There are only three fields that the user needs to fill:
- Name
- Function
- Original
The rest of the fields are implementation details. You can combine descriptions of all hooked functions and use macros to make the code more compact:
#define HOOK(_name, _function, _original)                    \
        {                                                    \
            .name = (_name),                                 \
            .function = (_function),                         \
            .original = (_original),                         \
        }

static struct ftrace_hook hooked_functions[] = {
        HOOK("sys_clone",   fh_sys_clone,   &real_sys_clone),
        HOOK("sys_execve",  fh_sys_execve,  &real_sys_execve),
};Now, let’s see what the hooked function wrapper looks like.
static asmlinkage long (*real_sys_execve)(const char __user *filename,
                const char __user *const __user *argv,
                const char __user *const __user *envp);

static asmlinkage long fh_sys_execve(const char __user *filename,
                const char __user *const __user *argv,
                const char __user *const __user *envp)
{
        long ret;

        pr_debug("execve() called: filename=%p argv=%p envp=%p\n",
                filename, argv, envp);

        ret = real_sys_execve(filename, argv, envp);

        pr_debug("execve() returns: %ld\n", ret);

        return ret;
}real_sys_execveis the function pointer to the originalexecve()system call handler. This pointer can be called from within the wrapper. It’s extremely important to keep the function signature unchanged (the order, types of arguments, returned value, and ABI specifierasmlinkage) to ensure the call works correctly.fh_sys_execveis the wrapper function that will be invoked instead of the original handler. It receives the same arguments as the original function, and its return value is passed back to the caller. This wrapper can execute arbitrary code before, after, or instead of the original function.
Now, hooked functions have a minimum of extra code.
The only thing requiring special attention is the function signatures. They must be completely identical. Otherwise, the arguments will be passed on incorrectly and everything will go wrong.
This isn’t as important for hooking system calls, though, since their handlers are rather stable and, for performance reasons, the system call ABI and function call ABI use the same layout of arguments in registers.
2. Initialize ftrace
We start initializing ftrace by finding and saving the hooked function address. When using ftrace, we can trace the Linux kernel by the function name. However, we still need to know the address of the original function in order to call it.
Let’s use kallsyms — a list of all kernel symbols — to get the address of the target function. This is what the process of getting the hooked function address looks like:
static int resolve_hook_address(struct ftrace_hook *hook)
{
        hook->address = kallsyms_lookup_name(hook->name);

        if (!hook->address) {
                pr_debug("unresolved symbol: %s\n", hook->name);
                return -ENOENT;
        }

        *((unsigned long*) hook->original) = hook->address;

        return 0;
}Next, we need to initialize the ftrace_ops structure:
int fh_install_hook(struct ftrace_hook *hook)
{
        int err;

        err = resolve_hook_address(hook);
        if (err)
                return err;

        hook->ops.func = fh_ftrace_thunk;
        hook->ops.flags = FTRACE_OPS_FL_SAVE_REGS
                        | FTRACE_OPS_FL_IPMODIFY;

        /* ... */
}fh_ftrace_thunk ()is our callback that ftrace will call when tracing the function.FTRACE_OPS_FL_SAVE_REGSandFTRACE_OPS_FL_IPMODIFYare flags needed for hooking, as they command ftrace to save and restore the processor registers whose contents we’ll be able to change in the callback.
Now, we’re ready to turn on the hook using:
ftrace_set_filter_ip()to turn on the ftrace utility for the target functionregister_ftrace_function()to give ftrace permission to call our callback
int fh_install_hook(struct ftrace_hook *hook)
{
        /* ... */

        err = ftrace_set_filter_ip(&hook->ops, hook->address, 0, 0);
        if (err) {
                pr_debug("ftrace_set_filter_ip() failed: %d\n", err);
                return err;
        }

        err = register_ftrace_function(&hook->ops);
        if (err) {
                pr_debug("register_ftrace_function() failed: %d\n", err);

                /* Don’t forget to turn off ftrace in case of an error. */
                ftrace_set_filter_ip(&hook->ops, hook->address, 1, 0);

                return err;
        }

        return 0;
}To turn off the hook, let’s repeat the same actions but in reverse:
void fh_remove_hook(struct ftrace_hook *hook)
{
        int err;

        err = unregister_ftrace_function(&hook->ops);
        if (err) {
                pr_debug("unregister_ftrace_function() failed: %d\n", err);
        }

        err = ftrace_set_filter_ip(&hook->ops, hook->address, 1, 0);
        if (err) {
                pr_debug("ftrace_set_filter_ip() failed: %d\n", err);
        }
}When the unregister_ftrace_function() call is over, it’s guaranteed that there won’t be any activations of the installed callback or our wrapper in the system. We can unload the hook module without worrying that our functions are still being executed somewhere in the system.
3. Hook functions using ftrace
With main preparations done, let’s move to the Linux function hooking process.
The process is simple: ftrace is able to alter the register state after exiting the callback. By changing the %rip register (a pointer to the next executed instruction), we can change the function executed by the processor.
In other words, we can force the processor to make an unconditional jump from the current function to ours and take over control.
This is what the ftrace callback looks like:
static void notrace fh_ftrace_thunk(unsigned long ip, unsigned long parent_ip,
                struct ftrace_ops *ops, struct pt_regs *regs)
{
        struct ftrace_hook *hook = container_of(ops, struct ftrace_hook, ops);

        regs->ip = (unsigned long) hook->function;
}- Get the address of
struct ftrace_hookfor our function using thecontainer_of()macro and the address ofstruct ftrace_opsembedded in struct ftrace_hook. - Substitute the value of the
%ripregister in thestruct pt_regsstructure with the handler’s address. For architectures other than x86_64, this register can have a different name (such as PC or IP).
Note that the notrace specifier added to the callback requires special attention. This specifier can be used for marking functions that are prohibited for Linux kernel tracing with ftrace. For instance, you can mark ftrace functions that are used in the tracing process. By using this specifier, you can prevent the system from hanging if you accidentally call a function from your ftrace callback that’s currently being traced by ftrace.
Serhii, Senior Developer at Apriorit
The ftrace callback is usually called with a disabled preemption, though there may be some exceptions.
Since the wrapper and the original functions are executed in the same context, both functions have the same restrictions. For instance, if you hook an interrupt handler, then sleeping in the wrapper is still out of the question.
4. Protect the ftrace hook wrapper from recursive calls
There’s one catch in the code we gave earlier: when the wrapper calls the original function, this function will be traced again by ftrace, thus resulting in endless recursion.
We came up with a neat way of breaking this cycle using parent_ip — one of the ftrace callback arguments that contains the return address of the hooked function. Usually, this argument is used for building function call graphs. However, we can use it to distinguish the first traced function call from repeated calls.
The difference is significant: during the first call, the parent_ip argument will point to some place in the kernel, but during the repeated call it will only point to the inside of our wrapper. You should pass control only during the first function call. All other calls must let the original function be executed.
We can run the entry test by comparing the address to the boundaries of the current module with our functions. This approach is only reliable if the current module contains nothing other than the small wrapper function that calls the original (hooked) function. If the module includes other unrelated code or resources, the boundary check becomes unreliable and you will need a more precise validation method.
This is what a correct ftrace callback looks like:
static void notrace fh_ftrace_thunk(unsigned long ip, unsigned long parent_ip,
                struct ftrace_ops *ops, struct pt_regs *regs)
{
        struct ftrace_hook *hook = container_of(ops, struct ftrace_hook, ops);

        /* Skip the function calls from the current module. */
        if (!within_module(parent_ip, THIS_MODULE))
                regs->ip = (unsigned long) hook->function;
}As you can see, the process of hooking Linux kernel function calls with ftrace isn’t that complex, yet it works as intended.
However, when working on a full-scale solution, you should be careful with the ftrace hooking implementation, as some surprising nuances might appear along the way. In the next section, we share Apriorit’s experience facing and overcoming unexpected obstacles while working with hooking functions.
Read also
How to Debug the Linux Kernel with QEMU and Libvirt
Optimize your kernel engineering process by learning how to create a flexible QEMU-libvirt setup that lets you test changes, analyze crashes, and validate features without relying on dedicated hardware.

Unexpected nuances of working with ftrace: What we’ve learned along the way
At the testing stage of our project, we faced a particular issue: hooking functions on some distributions resulted in permanent system hanging.
Naturally, this problem occurred only on systems that were different from those used by our developers. We also couldn’t reproduce the problem with the initial hooking prototype on any distributions or kernel versions.
According to debugging logs, affected systems got stuck inside the hooked function. For some reason, the parent_ip still pointed to the kernel instead of the function wrapper when calling the original function inside the ftrace callback. This launched an endless loop wherein ftrace called our wrapper again and again while doing nothing useful.
Fortunately, we had both working and broken code and eventually discovered what was causing the problem. When we unified the code and got rid of unnecessary parts, we narrowed down the differences between the two versions of the wrapper function code.
This is the stable code:
static asmlinkage long fh_sys_execve(const char __user *filename,
                const char __user *const __user *argv,
                const char __user *const __user *envp)
{
        long ret;

        pr_debug("execve() called: filename=%p argv=%p envp=%pn",
                filename, argv, envp);

        ret = real_sys_execve(filename, argv, envp);

        pr_debug("execve() returns: %ldn", ret);

        return ret;
}And this is the code that caused the system to hang:
static asmlinkage long fh_sys_execve(const char __user *filename,
                const char __user *const __user *argv,
                const char __user *const __user *envp)
{
        long ret;

        pr_devel("execve() called: filename=%p argv=%p envp=%pn",
                filename, argv, envp);

        ret = real_sys_execve(filename, argv, envp);

        pr_devel("execve() returns: %ldn", ret);

        return ret;
}How can the logging level possibly affect system behavior?
Surprisingly, when we took a closer look at the machine code of these two functions, it became obvious that the reason behind these problems was the compiler.
It turns out that pr_devel() calls are expanded into no-op. This printk-macro version is used for logging at the development stage. And since these logs pose no interest at the operating stage, the system simply cuts them out of the code automatically unless you activate the DEBUG macro.
After that, the compiler sees the function like this:
static asmlinkage long fh_sys_execve(const char __user *filename,
                const char __user *const __user *argv,
                const char __user *const __user *envp)
{
        return real_sys_execve(filename, argv, envp);
}And this is where optimizations take the stage. In our case, the so-called tail call optimization was activated. If a function calls another and returns a function’s value immediately, this optimization lets the compiler replace the function call instruction with a cheaper direct jump to the function’s body.
Here is what this call looks like in machine code:
0000000000000000 :
   0:   e8 00 00 00 00          callq  5 <fh_sys_execve+0x5>
   5:   ff 15 00 00 00 00       callq  *0x0(%rip)
b: f3 c3 repz retqAnd this is an example of the broken call:
0000000000000000 :
   0:   e8 00 00 00 00          callq  5 <fh_sys_execve+0x5>
   5:   48 8b 05 00 00 00 00    mov    0x0(%rip),%rax
c: ff e0 jmpq *%raxThe first CALL instruction is the exact same __fentry__() call that the compiler inserts at the beginning of all functions. But after that, the broken and the stable code act differently. In the stable code, we can see the real_sys_execve call (via a pointer stored in memory) performed by the CALL instruction, which is followed by fh_sys_execve() with the help of the RET instruction. In the broken code, there’s a direct jump to the real_sys_execve() function performed by JMP.
The tail call optimization allows you to save some time by not allocating a useless stack frame that includes the return address that the CALL instruction stores in the stack. But since we’re using parent_ip to decide whether we need to hook, the accuracy of the return address is crucial for us. After optimization, the fh_sys_execve() function no longer saves the new address on the stack, so there’s only the old one leading to the kernel. And this is why the parent_ip keeps pointing inside the kernel and that endless loop appears in the first place.
This is also the main reason why the problem appeared only on some distributions. Different distributions use different sets of compilation flags for compiling modules. And in all the problem distributions, tail call optimization was active by default.
We managed to solve this problem by turning off tail call optimization for the entire file with wrapper functions: #pragma GCC optimize(“-fno-optimize-sibling-calls”).
The goal of our ftrace research was to enable system activity monitoring and preemptively block suspicious processes in a project. However, we also know that hackers might use kernel function hooking with a malicious intent: to hurt a system, gain unauthorized access, or steal data. So, let’s explore a few ways you can protect your Linux kernel modules from ftrace hooks.
Read also
How to Perform Comprehensive Linux Kernel Module Security Testing
Strengthen the security of your Linux kernel modules with proven testing techniques that uncover vulnerabilities early and prevent system-wide risks.
How to protect a Linux kernel module from ftrace hooks: practical examples
If there’s a way to hook kernel functions using ftrace, there must be a way to protect kernel modules from such hooks.
Function hooks can be used for different purposes, from monitoring system performance to patching a specific bug. But if you want to make sure that kernel module functionality remains unchanged, you must be able to prevent the installation of any hooks.
How can you protect a Linux kernel module from ftrace hooks? In theory, there are two ways to do this:
- Hook the ftrace hooking functions themselves. In this case, we would need to hook ftrace functions that can set hooks, such as ftrace_set_filter_ip or ftrace_set_hash. Then, theoretically, once the framework tried to hook a function from our module, we would be able to block it. We could use the addresses of our module functions from the .text section to distinguish our kernel module functions from other functions.
- Modify ftrace structures. For this, we would need to delete all information about our module functions that’s stored in the records and structures of the ftrace framework. Then, to make blocking of ftrace hooks possible, we would also need to fill the mcount records with nop instructions.
To demonstrate both methods, we’ll start with a simple kernel module named TestModule. The name of the function that ftrace wants to hook is HookMe:
void HookMe(void)
{
    KLOGI("Try to hook me");
}Let’s see which of these methods proves effective, starting with the one that seems most logical: using ftrace hooks against themselves.
1. Hooking an ftrace hooking function
1. Set a hook for one of the ftrace functions responsible for hooking function calls. In our example, we’ll try to hook the ftrace_set_hash function:
#define REGISTER_FUNC(NAME) {&NAME ## _handler, (unsigned long*)&NAME ## _orig, #NAME}

struct SyscallHookInfo
{
    void*           callback;
    unsigned long*  orig;
    unsigned char*  name;
};

extern int (*ftrace_set_hash_orig)(struct ftrace_ops *ops, unsigned char *buf, int len, unsigned long ip, int remove, int reset, int enable);

static struct SyscallHookInfo g_hook = REGISTER_FUNC(ftrace_set_hash);2. Get the address of the ftrace_set_hash function:
*(g_hook.orig) = kallsyms_lookup_name(g_hook.name);
if (!*(g_hook.orig))
{
    KLOGE("Failed to get address for %s.", g_hook.name);
    return -EFAULT;
}3. Try registering a hook for this ftrace function:
res = ftrace_set_filter_ip(ops, *(g_hook.orig), 0, 0);
if (res < 0)
{
    KLOGE("Failed to set hook for %s. Error: %d\n", g_hook.name, res);
    return res;
}Unfortunately, this approach wasn’t successful. We got an error message when we tried to hook the ftrace_set_hash function:
[ 2978.777140] TestModule: SetFtraceHook: Failed to set hook for ftrace_set_hash. Error: -22The reason for this error is quite simple: apparently, ftrace can’t be hooked with its own methods. The framework protects against hooks being set in its critical functions, as mentioned here:
if (!ftrace_location(ip))
return -EINVAL;As a result, even though this seemed the most obvious and logical solution to our problem, we can’t use ftrace itself to protect our kernel module from ftrace function hooks.
2. Modify ftrace structures
Our next approach is a bit more cunning, since we need to delete some information from the ftrace records. Ftrace keeps all data about installed hooks in special ftrace pages. Each page is described by the ftrace_page structure:
struct ftrace_page {
    struct ftrace_page    *next;
    struct dyn_ftrace    *records;
    int            index;
    int            size;
};Here’s the key information to know about the ftrace_page structure:
- The size field of an ftrace page shows the size of the specific page in bytes.
- The index field displays the number of
dyn_ftracestructures that this page contains, sorted in dyn_ftrace.ip. - The
dyn_ftracestructure keeps the address (IP) of the mcount entry needed to set a hook for a selected function.
So, to block the setting of a function hook, we need to delete the dyn_ftrace structure related to a specific function and then fill its mcount entry with nop. Once the dyn_ftrace structure is deleted, we’ll also need to shift other entries by one for the current ftrace page.
Here are the key actions you need to do in order to protect your kernel functions against hooking using this method:
#define MAX_STUB_DISTANCE 30
const char g_nopCode[] = "\x90\x90\x90\x90\x90\x90\x90";

typedef int ftrace_cmp_recs_type(const void *a, const void *b);
typedef struct ftrace_rec_iter *ftrace_rec_iter_start_type(void);

struct {
    ftrace_cmp_recs_type *ftrace_cmp_recs;
    ftrace_rec_iter_start_type *ftrace_rec_iter_start;
} g_helpers = {};

int ShiftFtraceStub(void *data)
{
    struct NewFtraceStub* entry = data;
    int entrySize = sizeof(struct dyn_ftrace);
    int end = *(entry->index);
    int curr = 0;

    DisableWp();
    /*Filling the mcount entry with the nop option*/
    memcpy(entry->ip, g_nopCode, MCOUNT_INSN_SIZE);

    /*creating a loop for erasing the first entry and shifting all other entries by one*/
    for(; curr < end - 1; curr++)
    {
        char* curEntry = entry->entryForDeleting + curr * entrySize;
        memcpy(curEntry, curEntry + entrySize, entrySize);
    }
    *entry->index = curr;
    RestoreWp();

    return 0;
}

int res = -EADDRNOTAVAIL;
struct NewFtraceStub data = {0};

struct ftrace_page *pg = NULL;
struct ftrace_rec_iter *iter = NULL;
struct dyn_ftrace *rec = NULL;
struct dyn_ftrace key = {};

/*These functions are not listed in the Linux kernel headers, so we need to find them first*/
if (!g_helpers.ftrace_rec_iter_start)
{
    g_helpers.ftrace_rec_iter_start = (void *)kallsyms_lookup_name("ftrace_rec_iter_start");
    if (!g_helpers.ftrace_rec_iter_start)
    {
        KLOGE("Can't find ftrace_rec_iter_start");
        goto exit;
    }
}

if (!g_helpers.ftrace_cmp_recs)
{
    g_helpers.ftrace_cmp_recs = (void *)kallsyms_lookup_name("ftrace_cmp_recs");
    if (!g_helpers.ftrace_cmp_recs)
    {
        KLOGE("Can't find ftrace_cmp_recs");
        goto exit;
    }
}

key.ip = (unsigned long)HookMe;
key.flags = key.ip + MAX_STUB_DISTANCE;

iter = (*g_helpers.ftrace_rec_iter_start)();

for (pg = iter->pg; pg; pg = pg->next)
{
    if (key.ip < pg->records[0].ip || key.flags >= (pg->records[pg->index - 1].ip + MCOUNT_INSN_SIZE))
    {
        /*Searching the ftrace page for the dyn_ftrace struct related to our function*/

        continue;
    }
    /*Searching for our dyn_ftrace on the current page*/
    rec = bsearch(&key, pg->records, pg->index, sizeof(struct dyn_ftrace), g_helpers.ftrace_cmp_recs);
    if (rec)
    {
        data = (struct NewFtraceStub)
        {
            .ip = HookMe,
            .index = &pg->index,
            .entryForDeleting = (char*)rec,
        };

    res = stop_machine(ShiftFtraceStub, &data, 0);
    }
}We can use the following script to check if this approach prevents ftrace hooking:
dir=/sys/kernel/debug/tracing
sysctl kernel.ftrace_enabled=1
echo function > ${dir}/current_tracer
echo HookMe > /sys/kernel/debug/tracing/set_ftrace_filter
echo 1 > ${dir}/tracing_on

#TestBinary calls HookMe in the kernel space
./TestBinary

echo 0 > ${dir}/tracing_on
cat ${dir}/trace | grep HookMeHere’s what we get when we don’t use this type of protection against ftrace hooks:
kernel.ftrace_enabled = 1
TestBinary-2465 [000] .... 275.733572: HookMeHowever, when using this type of Linux kernel module protection, we get the following result:
sh: echo: I/O error
TestBinary-3035 [000] .... 715.803182: printk <-HookMeWe’ll also receive the exact same sh: echo: I/O error if the HookMe function isn’t loaded.
This method works and can be used for protecting a Linux kernel module from ftrace hooks.
Related project
Supporting and Improving Legacy Data Management Software
Discover how Apriorit helped a client stabilize and enhance a legacy data management system, delivering code improvements, performance optimizations, and long-term maintainability without the cost of full system replacement.
Deliver successful and secure Linux projects with Apriorit
With 20+ years of experience in cybersecurity-focused and low-level development, Apriorit is ready to ease your struggles with Linux tasks.
Leverage our expertise to design, debug, and optimize Linux projects. Our engineers will bring stability, performance, and reliability to your solution. From kernel-mode hooks and patches to real-time modifications and custom driver development ー delegate your tasks to tech gurus.

As a security-focused software development vendor, we follow secure SDLC principles to safeguard each and every project. By partnering with Apriorit, you get access to cybersecurity engineers who deploy robust protection measures and ensure your Linux systems remain resilient against evolving threats and targeted attacks. We also offer professional reverse engineering services.
Conclusion
Though the ftrace framework is mostly used for tracing Linux kernel functions, we’ve successfully used it to enable system activity monitoring, block suspicious processes, and hook function calls.
And even though this approach has some disadvantages, it gives you one crucial benefit: overall simplicity of both the code and the hooking process.
At Apriorit, we often use this approach when working on relevant projects and keep expanding our knowledge of Linux kernel capabilities.
Whatever project or task you need help with, our experienced kernel and driver developers and cybersecurity experts are ready to assist.
Need stronger security for your Linux systems or products?
Partner with Apriorit for strong skills in kernel and driver development, expertise in delivering successful Linux projects, and rich experience in cybersecurity!
FAQ
What is ftrace?
Ftrace is a helpful framework that can be used for completing various tasks, from tracing kernel functions to setting function hooks. This framework has been in development since 2008 and has quite an impressive feature set.
What data can you usually get when you trace kernel functions with ftrace?
Linux ftrace displays call graphs, tracks the frequency and length of function calls, filters particular functions by templates, and so on.
How can you configure kernel function hooking?
Use ftrace to alter the register state after exiting the callback. By changing the %rip register, you can change the function executed by the processor.
How can you enable ftrace in the Linux kernel?
<p>To enable ftrace, use kernel configuration parameters such as:</p>
<ul class=apriorit-list-markers-green>
<li><code>CONFIG_FUNCTION_TRACER=y</code></li>
<li><code>CONFIG_FUNCTION_GRAPH_TRACER=y</code></li>
<li><code>CONFIG_STACK_TRACER=y</code></li>
<li><code>CONFIG_DYNAMIC_FTRACE=y</code></li>
</ul>
What is a hook in Linux?
In Linux, a hook refers to a point in a software system where custom code can be inserted to modify or extend the system’s behavior without altering the original source code. This mechanism allows for flexibility and customization.
How can you protect a Linux kernel module from ftrace hooks?
In our experience, the best way to protect a Linux kernel module from ftrace Linux kernel hooks is by modifying ftrace structures. We tried hooking ftrace hooking functions, but this method didn’t work.


