 Skip to main content

Establishing robust security for your software is vital. Malicious actors keep using various types of malware and cybersecurity attacks to compromise applications on all platforms. You need to know the most common attacks and find ways to mitigate them.
This article isn’t a tutorial about heap overflows or heap spray exploitation. In it, we explore the heap spraying technique that allows attackers to exploit vulnerabilities in applications and execute malicious code. We define what heap spraying is, explore how it works, and show how to secure your applications from it.
This article will be helpful for developers who build antivirus and anti-exploit solutions, develop low-level user mode solutions for Windows, or want to know how to mitigate heap spraying attacks.
Contents:
What is the heap spraying technique and how does it work?
Heap spraying is a technique used in exploits to facilitate execution of the arbitrary code. The idea is to deliver a shellcode at a predictable address in the targeted application in order to execute this shellcode using a vulnerability. This technique is implemented by part of an exploit’s source code called the heap spray.
When implementing dynamic memory managers, developers face lots of challenges, including heap fragmentation. A common solution is to allocate memory in chunks of a fixed size. Usually, a heap manager has its own preferences for a chunk’s size as well as one or several reserved pools that allocate these chunks. Heap spraying makes a targeted process continuously allocate memory with required content block by block, banking on one of the allocations placing shellcode at the required address (without checking any conditions).
A heap spray itself doesn’t exploit any security issues, but it can be used to make an existing vulnerability easier to exploit.
It’s essential to understand how attackers use the heap spray attack to know how to mitigate it. Here’s what an average attack looks like:
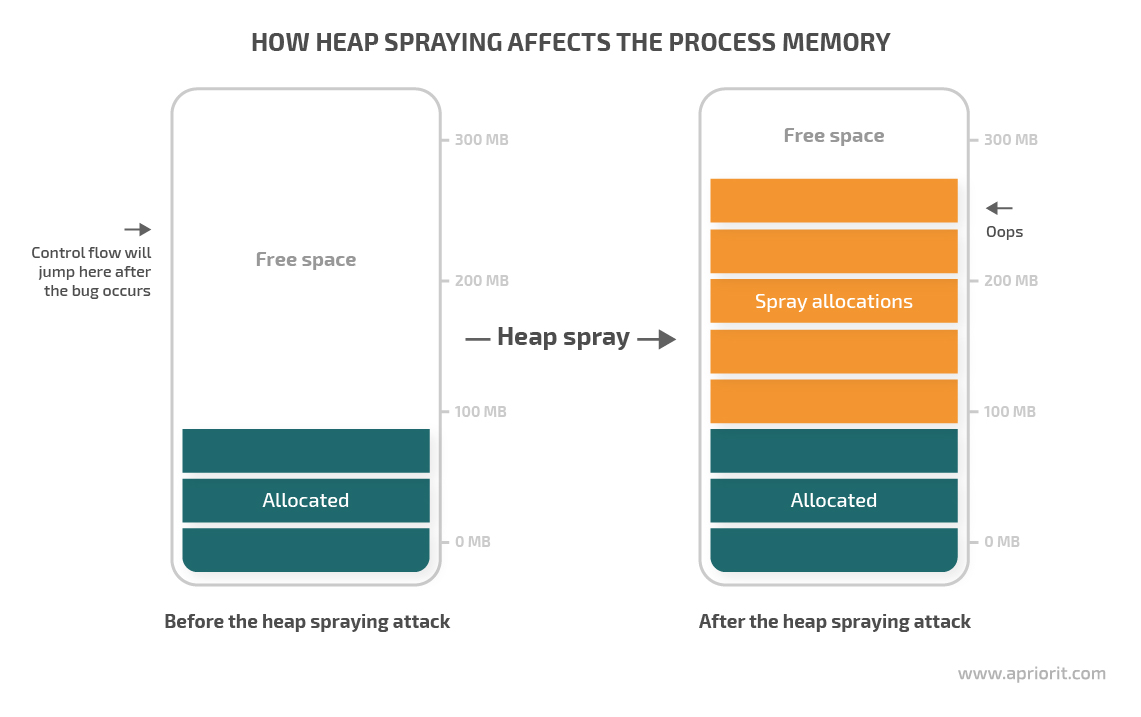
There are two major stages of a heap spraying attack:
- Memory allocation stage. Some flow continuously allocates lots of memory in chunks of a fixed size with the same content.
- Execution stage. One of these heap allocations receives control over the process memory.
As you can see, a heap spray attack with this exploit technique looks like continuous spam in the form of chunks of the same size with the same content. If a heap spraying attack succeeds, control is passed to one of these chunks.
To execute a heap spray attack, hackers allocate lots of memory of the required size in the target process and to fill those allocations with identical content. This requirement may seem too bold, but the most common cases of heap spraying attacks include compromising web app vulnerabilities. Any application that supports scripting languages (for example, Microsoft Office with its Visual Basic) is a potential victim for a heap spraying attack.
Thus, it makes sense to expect an attack in the context of one flow, since scripts are usually executed in a single flow.
However, attackers can execute a heap spraying attack not only using scripting languages. Advanced heap spraying techniques include loading image files into the process and spraying the heap with a very high allocation granularity through the use of technologies introduced with HTML5.
Take your product’s security to a new level!
Let Apriorit experts implement the best protection practices and cutting-edge security features to keep your data safe.
The question here is which stage is suspicious enough for us to interfere and try to figure out if there’s an ongoing attack?
The memory allocation stage, when some flow fills lots of memory, is already suspicious. However, you should ask yourself whether there could be false positives. For instance, there may be scripts or code in your application that indeed allocate memory in a cycle, such as arrays or special memory pools. Sure, there’s little chance a script will allocate memory in the exact same heap chunks. But still, it isn’t a key requirement for heap spraying.
Instead, you should pay attention to the execution stage because it always makes sense to analyze heap allocations which receive control over the process memory. Thus, our analysis will focus specifically on allocated memory containing potential shellcode.
To distinguish the execution of the heap spray shellcode from ordinary JIT code generation, you can analyze the latest flow allocations that allocated a certain memory chunk, including the neighboring allocations in the flow. Note that memory in a heap is always allocated with the execute permission, which allows attackers to use the heap spraying technique.
Heap spraying mitigation basics
To successfully mitigate heap spraying attacks, we need to manage the process of receiving control over memory, apply hooks, and use additional security mechanisms.
The three steps towards securing your application from heap spray execution are:
- Intercepting the NtAllocateVirtualMemory call
- Making executable memory unexecutable during the attempt to allocate it
- Registering a structured exception handler (SEH) to handle exceptions that occur as a result of the execution of unexecutable memory
Now let’s explore each step in detail.
Receiving control over memory
We need to both monitor how the target process allocates memory and detect the execution of dynamically allocated memory. The latter assumes that memory allocated during heap spraying has execute permissions. If data execution prevention (DEP) is active (for x64, it’s always active by default) and there’s an attempt to execute memory allocated without the execute permission, an exception access violation will be generated.
A malicious shellcode can either expect to be executed in an application without DEP (which is unlikely) or use a scripting engine that allocates memory in a heap with the execute permission by default.
We can prevent the execution of malicious code by intercepting an allocation of executable memory and making it unexecutable in a way that is unnoticeable to the exploit that allocated it. Thus, when the exploit thinks a spray is safe to execute and attempts to delegate control to the sprayed heap, a system exception will be triggered. Then, we can analyze this system exception.
First, let’s explore what work with memory in Windows looks like from the point of view of a user mode process. Here’s how a huge memory volume is usually allocated:
HeapAlloc -> RtlAllocateHeap -> NtAllocateVirtualMemory -> sysenter
Where:
- HeapAlloc and RtlAllocateHeap are functions that allocate a block of memory from a heap.
- NtAllocateVirtualMemory is a low-level function that is part of the NTDLL and isn’t supposed to be called directly.
- sysenter is a processor instruction to switch into the kernel mode.
If we manage to replace NtAllocateVirtualMemory, we’ll be able to intercept heap allocation traffic in the process memory.
Related project
Developing a Custom Secrets Management Desktop Application for Secure Password Sharing and Storage
Our team developed a cybersecurity tool for a US-based company, leading to a 30% boost in their security score. With new tools for efficient access and secret management, our client now can be sure in the security of their data.

Applying hooks
To intercept the execution of the target function, NtAllocateVirtualMemory, we’ll use the mhook library. You can choose the original library or the improved version.
Working with the mhook library is easy: You need to create a hook that has the same signature as the target function and implement it by calling Mhook_SetHook. Hooks are implemented by overwriting the function prolog with a jmp instruction on the function body. If you’ve already worked with hooks, you should have no difficulties.
Security mechanisms
There are two security mechanisms that can help us mitigate heap spraying attacks: data execution prevention and structured exception handling.
Structured exception handling, or SEH, is an error handling mechanism specific to the Windows operating system. When an error occurs (for example, division by zero), the application’s control is redirected to the kernel, which finds a chain of handlers and calls them one by one until one of the handlers marks the exception as “handled.” Usually, the kernel will then allow the flow to continue its execution from the moment the error was detected.
From the process’s point of view, DEP looks like an appearance of an SEH exception of the EXCEPTION_ACCESS_VIOLATION error code at the moment of memory execution.
For x86 applications, we have two pitfalls:
- DEP can be turned off in the system parameters.
- A pointer to the list of handlers is stored in the stack, which provides two potential attack vectors: handler indicator overwriting and stack substitution.
In x64 applications, these problems don’t occur.
Preventing heap spraying attacks
Now, let’s move to practice. To prevent heap spray attacks, we’ll take the following steps:
- Form an allocation history
- Detect shellcode execution
- Detect a spray
Forming an allocation history
To intercept the execution of dynamically allocated memory, we’ll change the PAGE_EXECUTE_READWRITE flag to PAGE_READWRITE.
Let’s create a structure for saving allocations:
struct AllocationInfo
{
    void* baseAddress;
    size_t size;
    ULONG protect;
};Next, we’ll define a hook for NtAllocateVirtualMemory. This hook will reset the PAGE_EXECUTE_READWRITE flag and save allocations for which the flag was reset:
NTSTATUS WINAPI hookNtAllocateVirtualMemory
(
    HANDLE      ProcessHandle,
    PVOID       *BaseAddress,
    ULONG_PTR   ZeroBits,
    PSIZE_T     RegionSize,
    ULONG       AllocationType,
    ULONG       protect
)
{
    /* … */
    AllocationInfo info {};

    if (protect & PAGE_EXECUTE_READWRITE)
    {
        info.protect = protect;
        protect &= ~PAGE_EXECUTE_READWRITE;
        protect |= PAGE_READWRITE;
    }

    status = g_origNtAllocateVirtualMemory(/* … */);

    if (status >= 0)
    {
        if (info.protect)
        {
            info.baseAddress = *BaseAddress;
            info.size = *RegionSize;
            // we affect this region
            g_allocations.push_back(info);
        }
    }

    return status;
}Once we set the hook, any memory allocation with the PAGE_EXECUTE_READWRITE bit will be modified. When there’s an attempt to pass control to this memory, the processor will generate an exception that we can detect and analyze.
In this article, we ignore multithreading issues. However, in real life, it’s better to store allocations of each flow separately, since the shellcode execution is expected to be single-threaded.
Read also
How to Enhance Your Cybersecurity Platform: XDR vs EDR vs SIEM vs IRM vs SOAR vs DLP
Stay ahead in the evolving cybersecurity market by strategically enhancing your product. Discover six key development vectors that can help you meet market demands and future-proof your solution.

Detecting shellcode execution
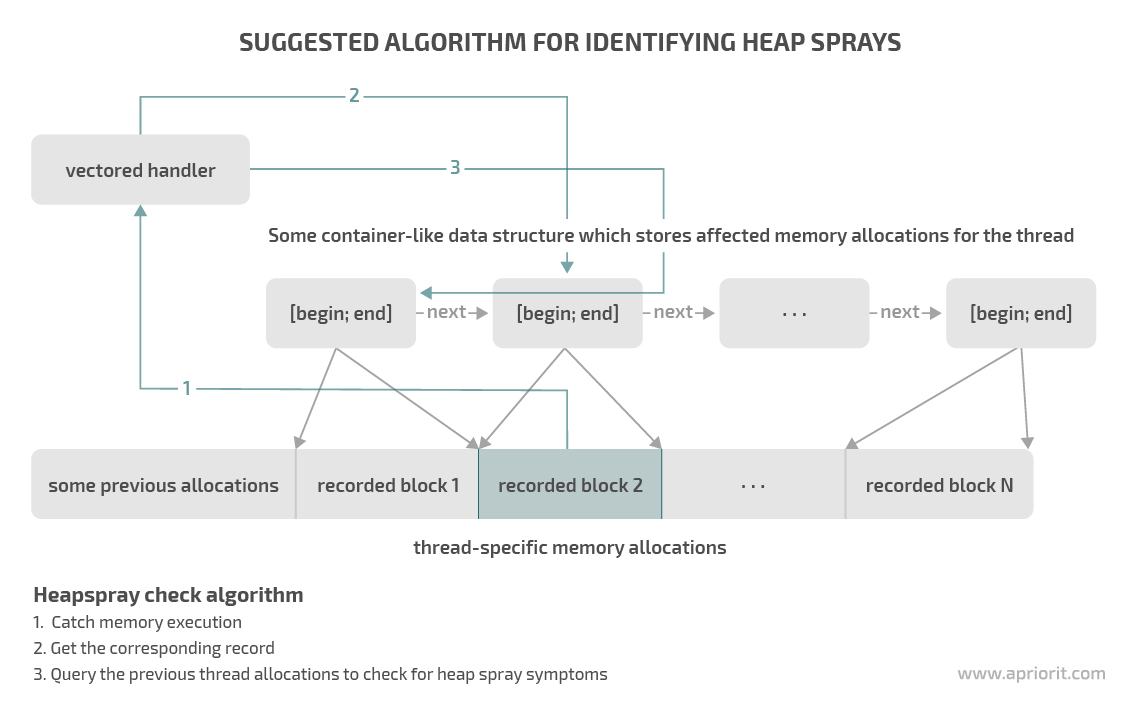
Now, we’ll register a handler for the SEH. This is how this handler usually works:
- Extract the address of the instruction that triggered an exception. If this address belongs to one of the regions we saved, this exception has been triggered by our actions. Otherwise, we can skip it and let the system keep searching for a relevant handler.
- Search for heap spray. In case of suspicious execution of the dynamically allocated memory, we have to react to a detected attack. Otherwise, we need to get things back as they were so the application can continue its work.
- Restore the original parameters of the region using the NtProtect function (PAGE_EXECUTE_READWRITE).
- Pass control back to the process flow.
Here’s an example of code for shellcode detection:
LONG __stdcall vectoredHandler(PEXCEPTION_POINTERS ExceptionInfo)
{
    /* … */
    PVOID executedAddress = ExceptionInfo->ExceptionRecord->ExceptionAddress;
    auto infoIter = /* find saved region */
    if (infoIter == end(g_allocations))
    {
        // not our region
        return EXCEPTION_CONTINUE_SEARCH;
    }

    // a good place to check for a heap spray

    // restore protection if there’s no shellcode in a heap
    bool result = VirtualProtect(/*original protect from AllocInfo*/);
    /* … */
    return EXCEPTION_CONTINUE_EXECUTION;
}Currently, we have a mechanism that monitors shellcode in our application and can detect the moment of its execution. In a real-life scenario, we’ll need to implement two more steps:
- Intercept NtProtectVirtualMemory and NtFreeVirtualMemory functions. Otherwise, we won’t have an opportunity to monitor the relevant state of the process memory. This is a fragmentation issue: We need to store and update a map of the executable memory of a process, which is a nontrivial task. For example, our application can free part of pages in the middle of our saved region using the NtFree function or change their flags to NtProtect. We need to track and monitor such cases.
- Analyze all possible flags with Execute (a set of possible values that allow us to execute the memory content), such as the PAGE_EXECUTE_WRITECOPY flag.
Related project
Developing a Custom MDM Solution with Enhanced Data Security
Explore the story of our US customer who delivers secure media and communication tools to federal institutions. We developed a tamper-proof MDM solution with centralized device management and a custom media content store. Our client has already released 5,000 tablets to their customers.

Detecting a heap spray
Using the code above, we’ve stopped an application at the moment of dynamic memory execution and gotten a history of the latest allocations. We’ll use this information to determine whether our application was attacked. Let’s explore two steps of our heap spraying detection technique:
- First, we need to decide how many allocations we will store and how many of them we’ll analyze when an exception occurs. Note that we’re interested in allocations of the same size. So if memory in a flow was allocated in different sizes, we can allow the flow to continue executing, since it’s unlikely this is a heap spraying attack. Also, we can rule out the possibility of a heap spraying attack in case of spaces between allocation borders, since heap spraying implies continuous memory allocations.
- Next, we need to choose criteria for heap spray detection. An effective way to detect heap sprays is to search for the same content across memory allocations. This repeated content is likely to be copies of the shellcode. For instance, say we have 10,000 allocations with the same data for the same displacement. In this case, it’s best to start searching from the current allocation’s displacement that received control.
We recommend using the described technique and paying attention to the following four criteria to exclude unnecessary checks that may significantly slow down your application:
- Define the number of saved memory allocations for each thread.
- Set the minimum size of saved memory allocations. Intercepting allocations that have a size of one page will lead to irrationally saved memory. Heap spraying usually operates with huge values picked for a specific heap manager of a certain application. Tens and hundreds of pages seem more relevant.
- Define the number of latest allocations that will be analyzed when an exception occurs. If we process too many allocations, it will reduce an app’s efficiency because for each execution of dynamic memory, we will have to read the content of large regions.
- Set the expected minimum size of a shellcode. If the size of the code we’re searching for is too small, it will increase the number of false positives.
Conclusion
We explored one approach to detecting heap spraying attacks using hooks and memory protection mechanisms. In our projects, this approach has shown excellent results during testing and heap spray detection.
You can find the source code with a demonstration of how this method works on our GitHub page.
At Apriorit, we have dedicated development teams that care for application security and are always ready to help you develop a sophisticated, well-protected solution.
Secure your software from sophisticated attacks
In their 20+ years of work, Apriorit’s cybersecurity experts have seen it all. Leverage their experience to make sure your app’s protection is impenetrable.
Have a question?
Ask our expert!
VP of Innovation and Technology, Canada Branch Director


