 Skip to main content


Key takeaways:
- Data visualization enhances cybersecurity platforms by representing complex data in a visual format that is easy to understand.
- To visualize cybersecurity threats, it’s important to work not only with complex data but also to analyze data connections.
- Knowledge graphs are advanced visualization tools that map relationships among system components, threats, vulnerabilities, and attack paths.
- With AI, knowledge graphs automate threat detection by identifying hidden patterns and unusual connections.
- Knowledge graphs are challenging to build and require robust data integration, computational resources, and ongoing maintenance to stay accurate and relevant.
Cybersecurity solutions process vast amounts of data to help their users detect vulnerabilities, understand attack patterns, and track security incidents. However, this data is too complex for humans to interpret without visual aids.
Data visualization allows cybersecurity specialists to understand data more easily using various graphs, maps, and charts. But to truly show insights into a system’s security, visualizations should reflect the complex relationships between data points from different software and network components.
Adding knowledge graphs to your cybersecurity product will allow users to map the relationships between threats, vulnerabilities, and network components, providing a full picture of the organization’s security posture. When enhanced with AI, knowledge graphs can provide predictive insights, automate threat detection, and simplify security analysis with natural language queries.
Are you considering adding data visualization features to your cybersecurity product? This guide will help you understand:
- What is the role of data visualization in cybersecurity?
- How do knowledge graphs enhance cybersecurity threat detection?
- What are the key benefits of using knowledge graphs for security analysis?
- How can you enhance cybersecurity data visualization with AI?
- How can you integrate data visualization into your cybersecurity product?
Contents:
- What is data visualization in cybersecurity and why does it matter?
- Knowledge graphs: the most advanced approach to cyber threat visualization
- How do knowledge graphs work: core components
- Enhancing knowledge graphs with AI for superior cybersecurity insights
- Challenges and limitations of implementing knowledge graphs
- How Apriorit can help you enhance your product with data visualization
- Conclusion
What is data visualization in cybersecurity and why does it matter?
Data visualization is the process of representing data with visual tools like graphs, charts, or maps, allowing people to make sense of complex information more easily. Its main goals are to simplify data, aid decision-making, and improve communication between team members and stakeholders.
In cybersecurity, data visualization reflects security events, attack patterns, and network activity.
The most popular formats of cybersecurity visualization include:
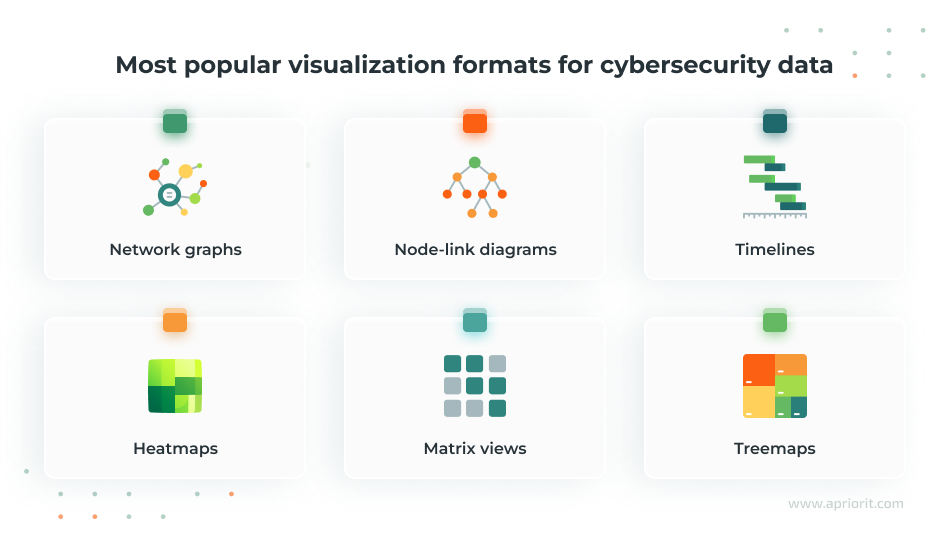
- Network graphs – Illustrate connections between devices, users, and threats
- Node-link diagrams – Map relationships between different network components
- Timelines – Track security events over time and analyze attack sequences
- Heatmaps – Highlight areas of high-risk activity or suspicious behavior
- Matrix views – Compare and analyze large sets of security data
- Treemaps – Display hierarchical structures, such as access control layers
These traditional visualization formats can help represent individual components of a system. However, they fall short when it comes to revealing the complex and interconnected nature of cyber threats and incidents.
To help cybersecurity specialists understand how different elements of their systems interact and influence each other, cybersecurity providers increasingly adopt knowledge graphs. In the next section, we explore how knowledge graphs can enhance the visualization of cyber threats in your cybersecurity product.
Want to power your cybersecurity product with data visualization?
Leverage Apriorit engineers’ expertise to enhance your product’s usability and competitiveness with advanced data visualization.
Knowledge graphs: the most advanced approach to cyber threat visualization
A knowledge graph is a way to represent information by mapping relationships between different entities. In cybersecurity, this approach to visualization mirrors how cyber threats operate — through relationships rather than isolated events.
In knowledge graphs, every compromised credential, suspicious login pattern, and breach attempt is visible and interconnected, allowing cybersecurity teams to analyze threats dynamically and see the bigger picture instead of responding to individual alerts.
For example, instead of just tracking a user’s login attempts, a knowledge graph shows whether a specific user with access to critical infrastructure exhibits unusual behavior, like accessing resources after hours. This allows cybersecurity specialists to quickly detect potential insider threats or compromised credentials before they result in incidents.
What are knowledge graphs used for in cybersecurity?
Knowledge graphs are complex, multifaceted tools that go beyond visualizing separate parts of your system. Their use cases can be quite wide and include:
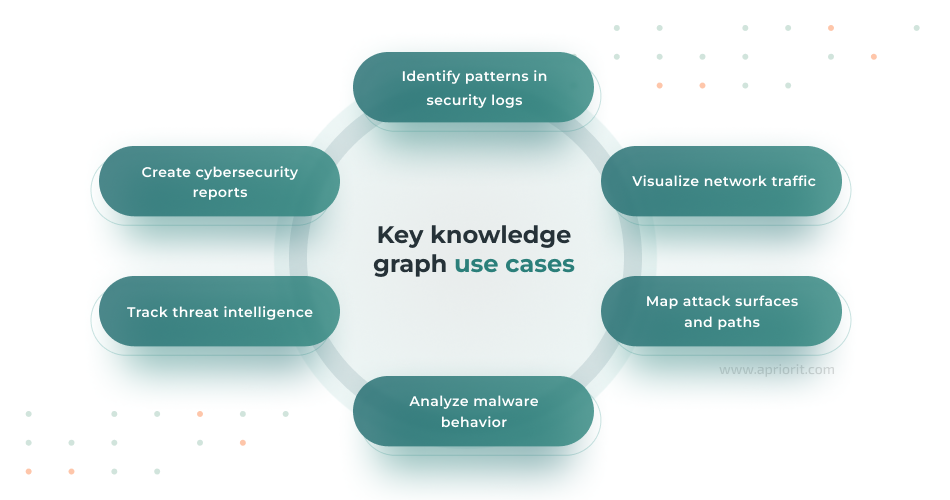
- Identify patterns in security logs – Knowledge graphs detect correlations between security events and activities that may not be obvious at first glance. This allows security teams to quickly respond to incidents and minimize damage or prevent security incidents altogether.
- Visualize network traffic – By mapping network connections, knowledge graphs show real-time traffic flow between network nodes and detect unusual communication or lateral movement attempts within the organization’s infrastructure.
- Map attack surfaces and paths – Knowledge graphs help identify even the most subtle patterns that can indicate attacks, as they track system activity, relationships between threats, and vulnerabilities all at the same time.
- Analyze malware behavior – By connecting malware data, indicators of compromise (IOCs), and execution behaviors, knowledge graphs can help researchers track how malware spreads, evolves, and interacts with various systems. This can help study new malware and put relevant defenses in place to prevent future attacks.
- Track threat intelligence – Knowledge graphs integrate data from threat intelligence feeds, linking information about threat actors, TTPs (tactics, techniques, and procedures), and previously observed attacks to provide a more comprehensive view of ongoing threats.
- Create cybersecurity reports – Security teams can use knowledge graphs to generate detailed visual reports on security incidents, compliance statuses, and risk assessments. These reports can be used for multiple purposes, from internal training and communication between teams to compliance audits and regulatory reporting.
All these knowledge graph applications allow cybersecurity teams to:
- Quickly detect and respond to threats
- Make data-driven decisions based on deep insights about their systems and threats
- Enhance communication with stakeholders and between teams using clear, visualized data
Now, let’s analyze the structure and operations of a knowledge graph.
Read also
The 6 Most Common Security Issues in API Development and How to Fix Them
Protect the sensitive data flowing through your APIs. Learn about the most common API threats and discover how to make your APIs safe against hacker attacks in our expert guide.

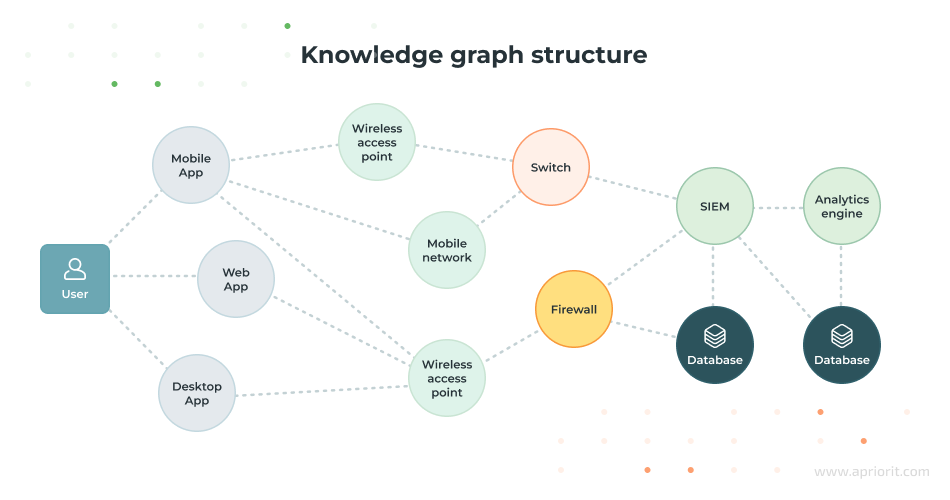
How do knowledge graphs work: core components
Knowledge graphs use graph databases to store data in a node–edge format, where nodes are data points and edges are relationships between them. To better understand how a knowledge graph works, let’s look at its core components:
1. Nodes

Nodes are the core elements of a knowledge graph. They represent cybersecurity entities and store context-rich metadata that can include timestamps, threat confidence scores, geolocation, and forensic details. The more well-structured the nodes are, the more connections the graph can make and the better it can detect patterns between threats and elements of your system (or events in it).
Nodes can be added to the knowledge graph manually, or ingested automatically through a data ingestion pipeline, which we’ll discuss later.
Examples of nodes include:
- Infrastructure and network components – Servers, endpoints, cloud environments, IoT devices, VPN exits, and other components that can be targeted or used in cyber attacks.
- Users, accounts, and access control – Track identities and permissions within an organization. Examples include user profiles, privileged access, and authentication events.
- Security policies – Compliance rules, data access policies, and encryption standards.
- Indicators of compromise – Artifacts like IP addresses, malicious domains, or file hashes that could indicate cyber threats and help cybersecurity specialists detect malicious activity.
- Threat actors – Identify adversaries and their affiliations, including advanced persistent threat (APT) groups, ransomware gangs, and nation-state actors.
- Attack techniques and vulnerabilities – Describe how attacks are executed and which weaknesses are exploited. These nodes can include MITRE ATT&CK techniques, exploited CVEs, and types of malware.
- Security events and threat intelligence – Include real-time insights into cyber incidents and defenses, such as incident reports, threat intelligence feeds, and forensic logs.
The power of a knowledge graph comes from connecting these nodes to uncover relationships and patterns in the data, and this is possible thanks to edges, which we’ll discuss next.
2. Edges

Edges map the connections between different parts of your system and external sources of information like threat intelligence, helping you see patterns between seemingly unrelated events.
Examples of unobvious links between nodes:
- An exploited vulnerability may be used to gain access to an organization’s internal network.
- A compromised credential may enable an attacker to escalate privileges on a target system.
- A command and control server may be used to exfiltrate sensitive data from a compromised database.
Edges reveal attack paths and help cybersecurity specialists not only to track how attacks occur but also to anticipate the next steps based on initial events.
Related project
Supporting and Improving Legacy Data Management Software
Discover how Apriorit specialists improved user satisfaction with our client’s legacy system by improving supportability and preparing the system for migration to a new platform.
2. Data ingestion pipeline
The efficiency of a knowledge graph depends on how much high-quality information it has. While some information (like your system’s components) is static, there’s also dynamic information like cybersecurity reports and threat intelligence.
Data sources that can enrich your knowledge graph and are constantly updated include:
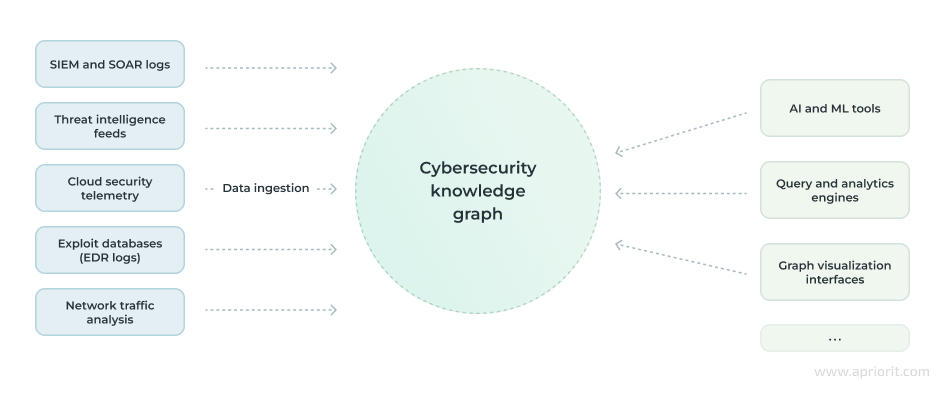
- SIEM and SOAR logs – Logs from platforms like Elastic Security or Palo Alto Cortex XSOAR provide your knowledge graph with information about security incidents and orchestrated responses.
- Threat intelligence feeds – Include data from sources such as MITRE ATT&CK and AlienVault OTX to track emerging threats and attack patterns.
- Cloud security telemetry – Sources like AWS GuardDuty, Azure Sentinel, and Google SCC offer insights into cloud infrastructure vulnerabilities and threats.
- Exploit databases – Information from CVE records and databases like ExploitDB helps track vulnerabilities and potential exploits.
- EDR logs – Data from endpoint detection and response solutions, such as CrowdStrike Falcon and Microsoft Defender, highlight endpoint-related threats and malware behavior.
- Network traffic analysis – Tools like Cisco Stealthwatch and Corelight give you visibility into network traffic for identifying anomalies and intrusions.
Data may also come from leaked credentials on the dark web, phishing intelligence feeds, and other sources.
Manually integrating this information into a knowledge graph is possible, but it’s quite tedious and time-consuming. You can automate this process by using a data ingestion pipeline that will collect, process, and convert data to ingest it into a graph database for you.
Data ingestion pipelines allow you to automatically track important data in real time, enabling your users to detect and respond to threats before they lead to breaches.
4. Query and analysis engine
A query and analysis engine provides analysts with a way to talk to a knowledge graph. By querying the graph through this engine, they can analyze the relationships between certain entities and perform targeted, complex, and context-rich searches.
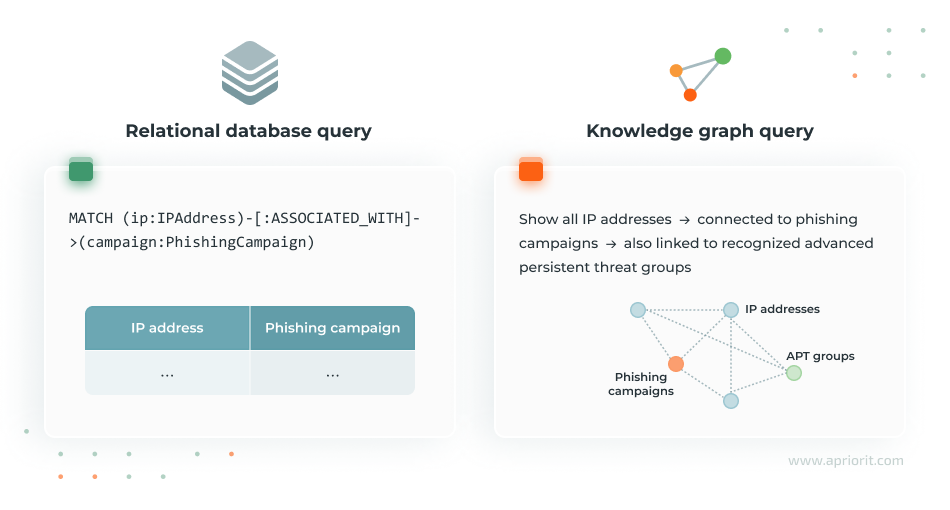
To query a knowledge graph, cybersecurity specialists make structured requests in a query engine using graph database query languages like Cypher, SPARQL, GQL, or Gremlin.
As a result of a complex query in a knowledge graph, you’ll get a visual representation of the relationships between entities.
As you can see, knowledge graphs are powerful tools for visualizing the whole system and detecting the relationships between system components, events, and cyber threats. But you can advance them even further and offer outstanding cybersecurity insights to your users by pairing them with AI technology.
Read also
Implementing Artificial Intelligence and Machine Learning in Cybersecurity Solutions
Leverage the power of AI and ML for your cybersecurity solution. Discover the benefits, limitations, and use cases of these cutting-edge technologies.
Enhancing knowledge graphs with AI for superior cybersecurity insights
While knowledge graphs are already quite complex and powerful, their functionality and convenience can be improved even further with artificial intelligence. AI can enhance the accuracy of a knowledge graph and make it more convenient and easy to use by:
- Enriching the graph with unstructured data – AI can use NLP to collect and structure data from unstructured sources like threat reports and research papers. This way, a knowledge graph gets more information about potential threats that would otherwise be overlooked.
- Improving the quality of incoming data – While a data ingestion pipeline feeds a knowledge graph with data, this data can sometimes contain duplicates, inconsistencies, or irrelevant details. AI can process, analyze, and refine this data automatically, improving the quality and accuracy of model visualization.
- Enabling predictive analytics – AI can enhance the knowledge graph’s ability to uncover patterns based on historical data and trends. This allows cybersecurity teams to prepare for potential incidents and put necessary protection measures in place.
- Automating anomaly detection – AI can help scan for unusual patterns, behavior, or seemingly unrelated events. Even if the security team hasn’t manually identified a connection between various system components or events within a graph, AI can detect such connections and alert the team to potential threats.
- Prioritizing and scoring threats – Instead of simply storing data, an AI-powered knowledge graph uses machine learning models to continuously assess and rank threats in real time based on their potential damage.
- Enabling natural language queries – AI-powered knowledge graphs enable security analysts to interact with the system using natural language. Instead of using a query language, analysts can ask questions in plain English and AI will convert them to the query language.
Enriching a knowledge graph with AI comes with its own set of challenges related to data collection, training, and maintenance. But even some AI functionality can help cybersecurity specialists access accurate information and process it faster, thus improving the overall security of their solutions.
Challenges and limitations of implementing knowledge graphs
While knowledge graphs bring immense value to cybersecurity specialists, implementing them can be quite challenging, as they do more than just visualize data. Without proper architecture and maintenance, knowledge graphs can become slow, unreliable, and ineffective.
Let’s look at some factors that can limit advanced threat detection through knowledge graphs.
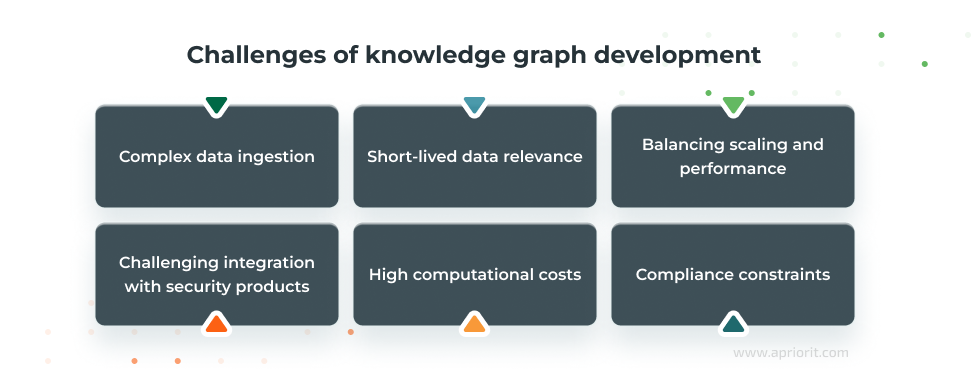
- Complex data ingestion – Knowledge graphs require large amounts of data from different sources like SIEM logs, threat intelligence feeds, and forensic reports. Each source uses its own data format, timestamps, and classification. To avoid data fragmentation, your data ingestion pipeline needs to be able to standardize data and eliminate duplicates and conflicts.
- Short-lived data relevance – Some data, like threat intelligence data, gets outdated quickly. You need to keep it fresh and eliminate irrelevant data so that your knowledge graph can keep processing information in real time.
- Balancing scaling and performance – Knowledge graphs handle millions of security events and entities, and as they grow, they require more and more computational resources. Without proper load balancing and optimization, your knowledge graph can become slow and unable to process deep or complex queries.
- Challenging integration with security products – Most enterprises already use SIEM, SOAR, or XDR systems. Your data visualization tool must be able to integrate with your users’ existing security ecosystem.
- High computational costs – Large-scale graph queries demand significant processing power and storage. To offer this functionality to your customers, you’ll need to consider high infrastructure costs, especially in cloud environments.
- Compliance constraints – Security data that goes into a knowledge graph often includes sensitive information. While this data is initially stored and processed in other systems, a knowledge graph must still adhere to regulations like the GDPR and to industry-specific standards. It should enforce robust access controls and data retention policies and should maintain data transparency for potential audits.
In addition to these challenges, you need to ensure regular maintenance and support for your knowledge graph to keep it efficient, accurate, and secure, which is something you may need professional assistance with.
Read also
6 Emerging Cybersecurity Trends for 2025 to Future-proof Your Product
Explore new security threats that may affect your product, and learn what new cybersecurity measures can help you mitigate risks to protect your software from breaches and your company from reputational damage.

How Apriorit can help you enhance your product with data visualization
At Apriorit, we have extensive experience implementing advanced data visualization cybersecurity solutions. Our team can help you choose the right tools and technologies, seamlessly integrate visualization capabilities into your cybersecurity solution, and enhance it with AI capabilities. Tasks our team can complete for you include:
- Integrating data visualization into your cybersecurity platform – Our experts can help you implement visualization capabilities in your system at any level, from simple visualization models to complex knowledge graphs.
- Augmenting your data visualization tools with real-time threat intelligence – If your platform already has visualization components, we can enhance them with real-time threat intelligence feeds so that your users can detect and respond to threats as they evolve.
- Designing and managing scalable infrastructure – You’ll get a robust and efficient infrastructure for your data visualization system that’s easy to scale along with your growing user base and increasing datasets, without losing performance.
- Developing custom integrations – Our team can integrate your visualization tools with SIEM, SOAR, XDR, and other security platforms so that your knowledge graph is always up to date with the latest cybersecurity developments.
- Automating insight generation with AI – By leveraging artificial intelligence and machine learning, we can automate pattern recognition, anomaly detection, and risk assessment within your data visualization framework, helping security teams identify potential threats faster.
- Creating high-quality datasets for training AI models – AI-powered data visualization graphs for cybersecurity rely on high-quality, domain-specific datasets. Our AI engineers will help you collect, structure, and refine cybersecurity data to train the AI model for advanced data visualization.
- Integrating natural language processing (NLP) for AI-powered queries – If you want to make your knowledge graph functionality accessible to non-technical cybersecurity specialists, we’ll help you train and integrate an NLP model for communicating with the visualization system in everyday language.
- Optimizing data storage and retrieval – To ensure seamless performance and scalability, our team can optimize your data storage and retrieval mechanisms, structuring data efficiently for fast querying and visualization.
- Providing maintenance and support for data visualization tools – Our specialists offer ongoing support so that your visualization tools stay efficient over time. We handle performance monitoring, security assessments, AI model fine-tuning and continuous optimization to ensure your cybersecurity visualization system remains reliable and insightful.
By partnering with Apriorit, you gain a team of experts who can help you build, fine-tune, and maintain your data visualization functionality and bring your cybersecurity product to the next level.
Our team has experience integrating data visualization and AI-driven analytics into security tools while following best practices for secure delivery from organizations like NIST.
Conclusion
Data visualization in cybersecurity products:
- Improves the user experience
- Speeds up threat detection and response
- Improves communication within cybersecurity teams
If you want to integrate advanced data visualization into your cybersecurity solution, we recommend knowledge graphs. They will help your users process vast amounts of security data, identify complex attack patterns, and shorten incident response times. However, building knowledge graphs requires careful data structuring, seamless integrations, and sometimes AI enhancements for automation, predictive analytics, and improved querying.
Apriorit’s cybersecurity and AI experts can help you design, implement, and optimize a data visualization solution tailored to your vision. Whether you need to build a knowledge graph from the ground up, enhance an existing knowledge graph with AI algorithms, or add data visualization to parts of your cybersecurity product, we have the expertise you need.
Looking for an expert cybersecurity development team?
Get a reliable partner in secure development who will implement advanced features into your cybersecurity product to make it more efficient and precise.
Have a question?
Ask our expert!
VP of Innovation and Technology, Canada Branch Director


