 Skip to main content

Key takeaways:
- OpenTelemetry helps teams overcome fragmented observability by standardizing how logs, metrics, and traces are collected across cloud-native and distributed systems.
- By decoupling instrumentation from analysis tools, OpenTelemetry reduces vendor lock-in and allows organizations to evolve their observability stack without re-instrumenting applications.
- Adopting OpenTelemetry requires deliberate decisions around telemetry volume, security, and compliance.
- An experienced cybersecurity team can help you build secure, scalable pipelines and unlock actionable insights from telemetry.
As cloud-native and cybersecurity systems grow more distributed, traditional monitoring tools struggle to provide consistent, end-to-end visibility.
Modern systems generate more telemetry than traditional monitoring can meaningfully interpret.
To better handle this growing complexity, teams often adopt OpenTelemetry as a shared framework for organizing logs, metrics, and traces across cloud-native environments.
To help your team move from isolated signals to unified observability, this article explains what OpenTelemetry is, how it works, and whether it should become part of your long-term observability strategy. It will be useful for CTOs and product leaders who are seeking practical advice on establishing a reliable observability system across distributed, security-sensitive environments and understanding where they may need expert guidance in this process.
Contents:
- OpenTelemetry: What it is and how it works
- How OpenTelemetry differs from other observability approaches
- OpenTelemetry architecture
- Observability challenges that OpenTelemetry solves
- Real-world OpenTelemetry applications in cloud-native systems
- Potential challenges of adopting OpenTelemetry
- How you can build secure OTel-based observability pipelines with Apriorit
OpenTelemetry: What it is and how it works
Modern cloud-native and cybersecurity products generate and process massive volumes of telemetry data: logs, metrics, traces, and security events coming from endpoints, microservices, APIs, and cloud infrastructure. This telemetry is the foundation for observability, threat detection, performance optimization, and operational resilience.
The challenge today is in consistently, efficiently, and securely collecting and using such data across complex environments.
In this case, observability is better than simple monitoring:
- Monitoring answers Is something broken?
- Observability answers Why is it broken, where, and under what conditions?
So, what is OpenTelemetry in this case? OpenTelemetry (OTel) is an open-source, vendor-neutral observability framework that standardizes how telemetry data is generated, collected, processed, and exported. It is governed by the Cloud Native Computing Foundation (CNCF) and has become the de facto industry standard for telemetry instrumentation across modern software systems.
Today, OTel is one of the fastest-growing CNCF projects. It has broad support across cloud providers, observability vendors, and security platforms and is considered a strategic foundation for scalable, secure, and flexible telemetry-driven systems. The benefits of OpenTelemetry are often discussed alongside tools like Prometheus or proprietary APM solutions. Next, we will break down the differences between these tools.
Bridge the gap between monitoring and security
Let our team help you integrate OpenTelemetry into your cybersecurity products while meeting compliance and performance goals.
How OpenTelemetry differs from other observability approaches
OpenTelemetry is often compared to tools like Prometheus, which is a metrics-focused monitoring system with a pull-based data collection model and a tightly integrated storage and query layer. OpenTelemetry, on the other hand, is a telemetry framework and not a monitoring back end. It is designed to:
- Support multiple telemetry signals
- Work across push- and pull-based models
- Decouple instrumentation from storage, analysis, and visualization tools
Tools like Prometheus and OTel work with telemetry data, but choosing between them is less about features and more about intent. While monitoring tools analyze telemetry data, OpenTelemetry defines how that data is created and shared. This perspective helps teams decide whether they need a specific tool today or a flexible foundation for the future of observability with OpenTelemetry.
To better understand where OpenTelemetry fits, it helps to compare it with other common observability approaches:
Table 1. OpenTelemetry vs. other observability approaches
| Aspect | Proprietary APM / monitoring tools | Prometheus | OpenTelemetry |
|---|---|---|---|
| Primary role | End-to-end monitoring platform | Metrics monitoring & storage | Telemetry framework |
| Supported signals | Usually metrics + traces | Metrics only | Logs, metrics, traces |
| Instrumentation coupling | Vendor-specific | Prometheus-specific | Vendor-neutral |
| Language support | Vendor-dependent | Limited (via client libraries; strongest support for Go) | Language-agnostic |
| Backend flexibility | Low | Medium | High |
| Best suited for | Fast setup, predefined insights | Metrics-focused monitoring | Standardized, long-term observability |
OpenTelemetry is language-agnostic and capable of translating telemetry into different formats. This gives your engineering team flexibility when working with heterogeneous technology stacks or evolving technology choices. So how does OpetTelemetry work? Let’s take a look.
OpenTelemetry architecture
OpenTelemetry separates how telemetry is generated from where it is analyzed. At a high level, applications and services are instrumented using OpenTelemetry APIs and software development kits (SDKs), which collect traces, metrics, and logs in a standardized format. This telemetry is then sent to the OpenTelemetry Collector, where it can be processed, filtered, or sampled before being exported to one or more observability or security back ends.
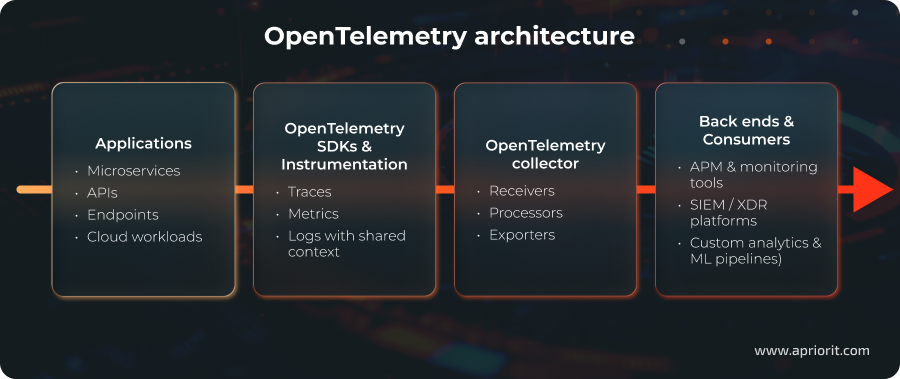
To understand how it works in practice, imagine a cloud-native cybersecurity platform with an API service, an authentication service, and a detection engine. When a user request flows through the system, OpenTelemetry helps capture and connect what happens at each step:
- A user request enters the API service, triggering an authentication flow and, later, a security detection event.
- OpenTelemetry instrumentation attaches shared context to the request as it moves across services.
- Traces show the end-to-end path of the request through the system.
- Metrics highlight performance indicators such as latency, error rates, or throughput.
- Logs capture security-relevant details tied to the same request.
- The OpenTelemetry Collector processes this telemetry, filtering noise and masking sensitive data.
- The same telemetry is forwarded to multiple systems, like an APM tool for performance analysis and a SIEM/XDR platform for security correlation.
With this flow, your team can understand both system behavior and security events using a single consistent telemetry pipeline. Now, let’s take a closer look at ways to solve practical observability problems in distributed environments with OTel.
Observability challenges that OpenTelemetry solves
Even though OpenTelemetry is not a universal solution, it can directly address several limitations that your team might face when working with modern observability stacks.
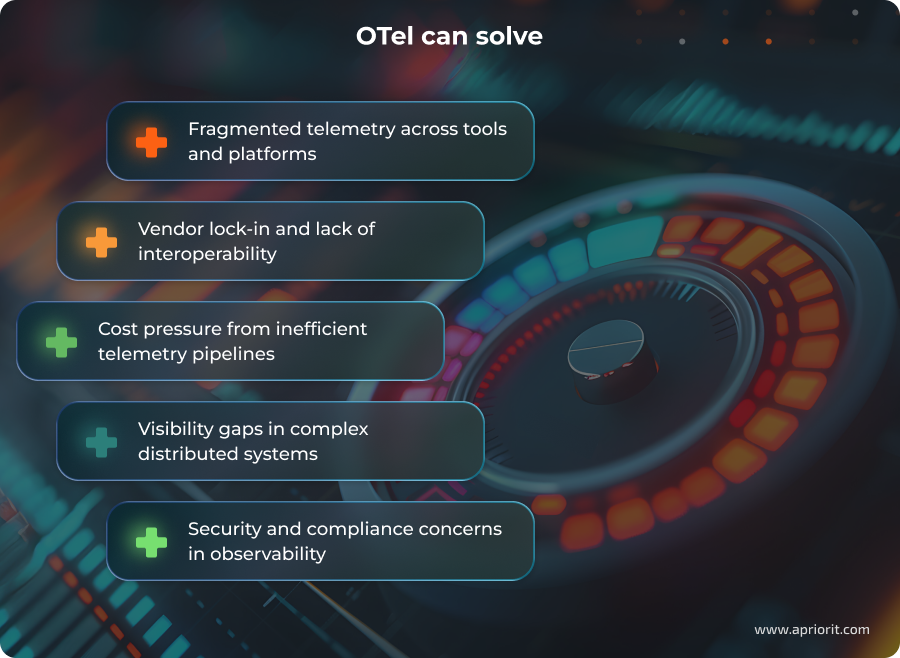
Fragmented telemetry across tools and platforms. In many organizations, telemetry is collected using multiple agents, formats, and SDKs, often tied to specific vendors. This fragmentation makes it difficult to correlate signals across services, environments, or security layers, especially in multi-cloud or hybrid architectures. OpenTelemetry standardizes telemetry generation and context propagation, regardless of where the data is ultimately stored or analyzed.
Vendor lock-in and lack of interoperability. Traditional observability setups often couple instrumentation tightly to a specific back end, making migrations or tool changes expensive and risky. OpenTelemetry decouples instrumentation from analysis tools by acting as a vendor-neutral telemetry layer, allowing the same data to be exported to multiple back ends or switched over time without re-instrumenting applications.
Cost pressure from inefficient telemetry pipelines. As telemetry volumes grow, so do ingestion, storage, and processing costs. When data is collected indiscriminately or duplicated across tools, observability quickly becomes a budget concern. To manage this, teams increasingly rely on centralized telemetry pipelines that allow them to filter, sample, and route data before it reaches cost-intensive back ends.
Visibility gaps in complex distributed systems. In microservices-based and event-driven architectures, issues rarely stay within a single service. Without consistent context propagation, teams struggle to understand how requests, events, or security incidents move across the system. OpenTelemetry improves visibility by preserving relationships between signals, which in turn facilitates end-to-end tracing and dependency analysis across services.
Security and compliance concerns in observability. Telemetry often contains sensitive operational or user-related data, which raises concerns around data exposure, access control, and regulatory compliance, especially for cybersecurity products. OpenTelemetry does not eliminate these risks, but it provides clear control points (such as the Collector) where encryption, masking, filtering, and governance policies can be enforced consistently.
With these OpenTelemetry adoption challenges addressed, the next question becomes how OpenTelemetry is applied in practice. Let’s take a closer look.
Read also
Build an Observability System to Know What’s Really Happening Inside Your Software (with a Practical Example)
Unlock deeper insights into your software ecosystem, identify bottlenecks, and improve operational efficiency. Our experts will help you build an observability stack designed to keep your systems stable and performant.

Real-world OpenTelemetry applications in cloud-native systems
OTel can be extremely useful in many observability scenarios in distributed systems, especially those where security, reliability, and compliance are critical.
Here are some of the most common use cases for OpenTelemetry in modern cloud-native and distributed systems.
- Distributed tracing for microservices. OpenTelemetry makes it possible to follow individual requests as they move across microservices, APIs, and background workers. This can be done by propagating trace context consistently between services and standardizing how spans are created and linked across different runtimes and protocols. As a result, your team can identify where latency is introduced, understand error propagation, and investigate incidents that span multiple services. Traces also provide valuable context during post-incident analysis and root-cause investigations.
- Observability standardization across teams and services. Since it applies a shared data model and instrumentation approach, OpenTelemetry reduces inconsistencies between how different teams collect and interpret telemetry. This is especially useful in large organizations where services are built with different languages, frameworks, and deployment models.
- Application performance monitoring (APM). OpenTelemetry supplies the telemetry needed to monitor latency, error rates, and throughput without tying instrumentation to a specific vendor. In cybersecurity platforms, this helps your team make sure that detection and response workflows meet performance requirements even under attack or peak load.
- Centralized logging with context. OTel helps centralize logs from distributed services into a unified pipeline while enriching them with trace and span context. This allows teams to correlate log entries with specific requests or users, which is particularly useful during security investigations that require reconstructing event sequences across multiple components.
- Telemetry gathering for operational decisions. OpenTelemetry offers a standardized way to collect metrics and traces that reflect how systems behave under real workloads. Your team can use this data to analyze capacity, scaling behavior, and reliability over time.
- Observability in hybrid and multi-cloud environments. OpenTelemetry provides a uniform way to collect telemetry across on-premises systems, public clouds, and managed services. This is particularly valuable for establishing consistent and thorough monitoring of systems deployed in diverse environments.
In all of these cases, OTel provides a shared observability layer that supports monitoring, analytics, and security workflows across the entire system lifecycle. At the same time, applying OTel at scale introduces its own set of trade-offs, which our experts break down in the next section.
Potential challenges of adopting OpenTelemetry
OpenTelemetry offers a powerful and flexible foundation for observability, but it also comes with a set of limitations. Your team should understand these challenges early when deciding how OpenTelemetry fits into your systems and processes.
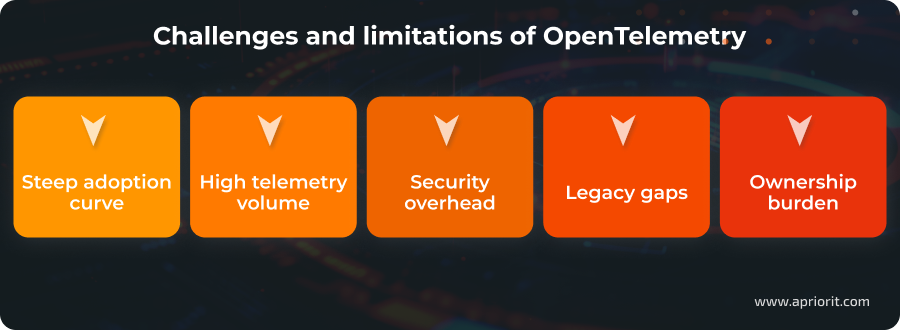
Learning curve and implementation effort. OTel is not a single tool that your team can implement instantaneously. Instead, it’s a collection of specifications, APIs, SDKs, and components that can be difficult to navigate initially. Teams often underestimate the effort required to design a consistent instrumentation and telemetry pipeline across services.
Telemetry volume and cost exposure. Managing observability costs is a challenge regardless of the tools you use, as modern systems generate large amounts of telemetry by default. OpenTelemetry does not automatically reduce this cost pressure. If data boundaries, sampling, and filtering are poorly designed, it can even amplify the problem by making it easier to collect more data than teams can effectively use.
Security and data governance overhead. Telemetry often carries sensitive operational data, identifiers, and contextual information that can be unintentionally exposed if pipelines are not properly designed. Ensuring proper encryption, access control, masking, and regulatory compliance adds complexity to observability pipelines, especially in cybersecurity and regulated environments.
Compatibility gaps with legacy and proprietary systems. Not all systems support OpenTelemetry natively. This is especially true for older platforms or closed commercial products. To bridge these gaps, you might need custom instrumentation, protocol translation, or additional components, which can increase maintenance efforts.
More ownership over observability architecture. Because OpenTelemetry is a framework, your team takes responsibility for how telemetry is instrumented, processed, and routed. This can strain teams without dedicated observability or platform engineering expertise.
These challenges don’t downgrade the value of OTel, but they show that successful adoption requires more than simply implementing a framework. Designing scalable telemetry pipelines, securing sensitive observability data, and integrating OpenTelemetry into complex, real-world environments often demands deep engineering and cybersecurity expertise.
This is where partnering with an experienced cybersecurity company can help you turn OpenTelemetry from a promising idea into a reliable, production-ready observability foundation.
Related project
Custom Cybersecurity Solution Development: From MVP to Support and Maintenance
Discover how we helped a business strengthen its software ecosystem, implement proactive security measures, and reduce potential threats through a fully customized cybersecurity strategy. for existing features.

How you can build secure OTel-based observability pipelines with Apriorit
Apriorit has hands-on production experience implementing OpenTelemetry in complex and high-load environments. We use OpenTelemetry in real projects to design and operate observability pipelines for security-critical and cloud-native products.
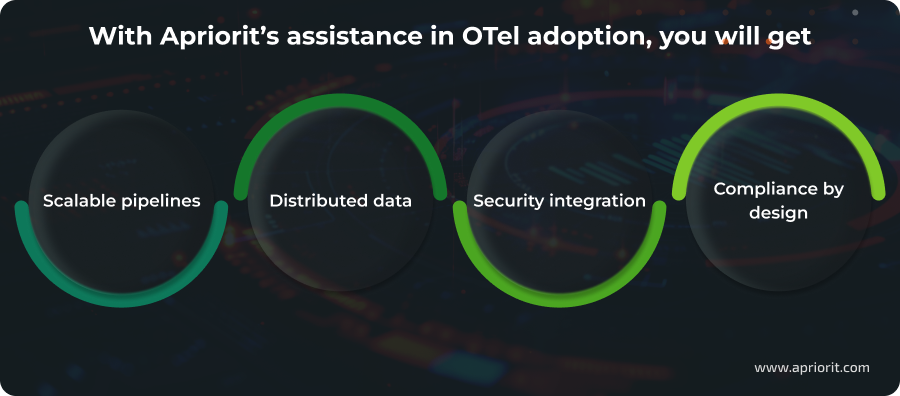
Scalable and cost-efficient telemetry pipelines. With Apriorit, you will get OpenTelemetry pipelines designed to handle high telemetry volumes without unnecessary cost or complexity. Our engineers will help you achieve predictable performance, controlled data growth, and governance aligned with your product and business goals.
Distributed data from endpoints and cloud environments. You’ll gain consistent, high-quality telemetry from endpoints, microservices, and cloud entities, all without compromising performance or security. As a result, your team will get trustworthy data for both operational visibility and security analytics, even in complex distributed systems.
Integration of security insights. We integrate OpenTelemetry with SIEM, XDR, and security analytics platforms, as well as cloud-native observability stacks and APM tools. This allows you to reuse the same telemetry for performance monitoring, threat detection, and incident investigation.
Compliance-ready observability by design. Your observability architecture is built with security, privacy, and compliance in mind from day one. All OpenTelemetry implementations by Apriorit follow secure SDLC practices and are backed by ISO 27001, ISO 9001, and GDPR-aligned processes.
Realizing OpenTelemetry’s full potential requires expertise in instrumentation, pipeline design, and secure implementation. With Apriorit’s deep engineering and cybersecurity background, you can accelerate observability maturity, build resilient telemetry architectures, and extract real business value from your observability data.
Secure, scalable observability made simple
Enhance your project with Apriorit’s secure SDLC, high-load engineering, and cybersecurity experience to gain full value from OpenTelemetry.
FAQ
Is OpenTelemetry a replacement for monitoring tools?
<p>No. OTel is a vendor-neutral framework for collecting and exporting telemetry data. It standardizes how logs, metrics, and traces are generated and delivered, but it relies on external back ends (APM, SIEM, observability platforms) for storage, visualization, alerting, and analysis.</p>
<p>OpenTelemetry complements existing monitoring and security tools instead of replacing them. This allows you to unify instrumentation, reduce vendor lock-in, and reuse the same telemetry across multiple tools and teams.</p>
How does OpenTelemetry differ from OpenTracing and OpenCensus?
<p>OpenTelemetry can be seen as a continuation of OpenTracing and OpenCensus that combines their concepts into a single standard. It supports a broader set of telemetry signals (traces, metrics, logs) under one specification, with consistent APIs, SDKs, and tooling.</p>
<p>Both OpenTracing and OpenCensus are now deprecated, and OpenTelemetry is the recommended path forward. For teams already using those projects, there are migration paths that help transition existing instrumentation to OpenTelemetry with minimal disruption.</p>
Is OpenTelemetry suitable for security-sensitive environments?
<p>Yes, but it requires deliberate design. OpenTelemetry itself is signal-agnostic and does not enforce security controls, which means organizations must implement:</p>
<ul class=apriorit-list-markers-green>
<li>Encryption</li>
<li>Access controls</li>
<li>Data masking</li>
<li>Governance within their telemetry pipelines</li>
For cybersecurity products and regulated environments, you can use OpenTelemetry safely when paired with secure collectors, filtered exports, and compliance-aware architectures. Many teams adopt OTel specifically to gain better visibility while maintaining strict security and privacy boundaries.
How much would it cost me to scale OpenTelemetry?
<p>OpenTelemetry is open-source and free to use, so the main expenses arise from telemetry volume, processing, storage, and downstream analysis tools. Without careful sampling, aggregation, and routing, telemetry data can grow quickly in high-throughput systems.</p>
<p>The key cost factor is not OpenTelemetry itself but how efficiently telemetry pipelines are designed and operated. Well-architected pipelines can help you control data growth and avoid unnecessary spending on observability as systems scale.</p>
How long does OpenTelemetry adoption typically take?
<p>Adoption timelines vary depending on system complexity, team maturity, and goals:</p>
<ul class=apriorit-list-markers-green>
<li>Initial instrumentation for a limited set of services can often be achieved within weeks.</li>
<li>Full-scale adoption across distributed systems usually takes several months.</li>
Most organizations adopt OpenTelemetry incrementally, starting with high-value services or use cases, then expanding coverage over time. This phased approach allows teams to refine their observability strategy as they gain experience.
Have a question?
Ask our expert!
VP of Innovation and Technology, Canada Branch Director


