 Skip to main content

Imagine that you’ve rolled out a new security product. Your team thoroughly checked everything before deployment. But right after release, you start receiving user complaints: missed vulnerabilities, incomplete event data, irrelevant alerts.
Most likely the issue isn’t the detection logic itself but rather a lack of reliable, structured telemetry data feeding it.
Making sure your cybersecurity solution efficiently collects all the required telemetry data is trickier than you might think. It’s crucial to carefully plan the infrastructure to make sure telemetry data is collected smoothly and brings valuable insights.
In this article, you will learn how carefully planned and implemented telemetry helps to detect threats and inefficiencies and to optimize system performance. You’ll also find valuable tips on choosing the technology stack and learn some finer points of telemetry infrastructure based on practical examples.
This article will be helpful for product leaders, project managers, and lead security engineers looking to:
- Enhance cybersecurity products (SIEM, EDR, XDR, PAM, etc.) by adding new functionalities
- Secure and optimize internal networks in corporate environments
Contents:
- Why use telemetry in security monitoring software?
- A basic scheme for using telemetry data to monitor server security
- Preparing for telemetry integration: What to consider
- Agent development
- Backend and frontend development
- Establishing communication between an agent and a monitoring server
- Transferring data from a monitoring server to the front end
- A practical example of building a solution for collecting telemetry data
- Conclusion
Why use telemetry in security monitoring software?
In IT, telemetry refers to collecting, transferring, and analyzing data about the operation of systems, apps, and devices for monitoring, diagnostics, and performance optimization.
Telemetry-enriched monitoring systems are able to gather data from multiple sources and use it for analysis and decision-making. Organizations leverage such software to:
- Collect various types of data: logs, events, traces, operational and performance data, etc.
- Get consistent, real-time information on the environments and systems under monitoring
- Detect operational issues that cause costly downtime and other inefficiencies
- Address challenges like data overload and system integration complexity
- Detect and mitigate threats early
Why use telemetry data monitoring?
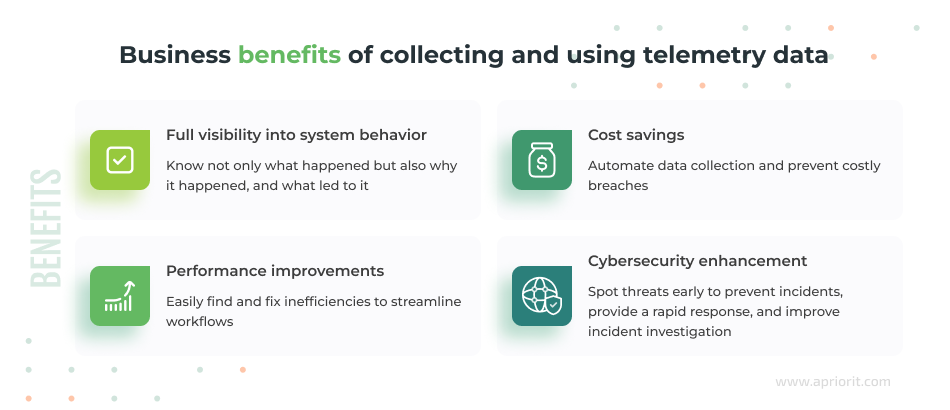
Telemetry data provides continuous information about processes, network activity, file access, user actions, and configuration changes. Thus, you gain full visibility into system behavior and can more quickly detect anomalies and vulnerabilities, reducing incident response times.
You also can save money and free up other resources by automating data collection processes and preventing costly breaches. Telemetry-enriched monitoring software helps you detect inefficiencies, vulnerabilities, and errors faster within your environments. Thus, your team can fix issues in a timely manner and achieve better cybersecurity and optimized system performance.
Integrating telemetry data collection and processing into your cybersecurity product also supports Digital Operational Resilience Act (DORA) compliance by enabling detailed audit trails and validating data integrity across systems.
Planning to collect and monitor telemetry data?
Whether you want to enhance your security software or secure your corporate environments, Apriorit is at your service. Reach out to discuss your needs and start your successful telemetry journey!
A basic scheme for using telemetry data to monitor server security
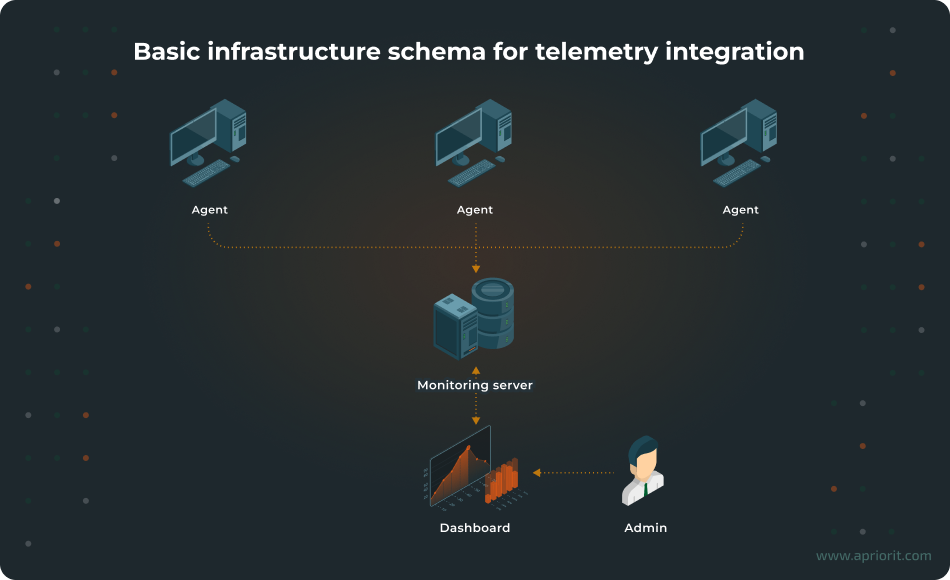
Say that you (or your end customer) have several servers in an office with an agent installed on them. This agent (sometimes called a daemon) tracks vulnerabilities and sends information about them to the admin dashboard in real time.
In such a scenario, you would probably want to collect data from servers, and in case of danger (or potential threats), you would want to receive alerts or have your security systems automatically carry out assigned actions. Also, your admins or security officers would need to see all relevant data on the dashboard.
Here’s a basic infrastructure to help you achieve these server security monitoring goals:
- An agent sends events from servers to a monitoring server.
- The monitoring server receives events and passes them to the front end of your solution.
- The front end listens for the received events and updates the dashboard’s interface in real time.
With this schema in mind, let’s take a look at technology options.
Related project
Custom Cybersecurity Solution Development: From MVP to Support and Maintenance
Discover how our experts designed and delivered a cybersecurity platform that enabled our client to mitigate risks, protect sensitive data, and operate with greater confidence in a highly regulated industry.

Preparing for telemetry integration: What to consider
When choosing the technology stack for telemetry implementation, your team must consider multiple things. For example, they must define what networks you want to monitor, the volume of data you need to collect, and the frequency of its collection. You also must decide whether you need one-way or two-way communication: server → client, or both server → client and client → server. Last but not least, you must check whether your agent, servers, and front end support the selected technologies.
In this article, we show simple examples to provide a general understanding of how to create and develop infrastructure for collecting telemetry data. Let’s briefly explore the details of choosing approaches, technologies, and tools for each step of telemetry integration.
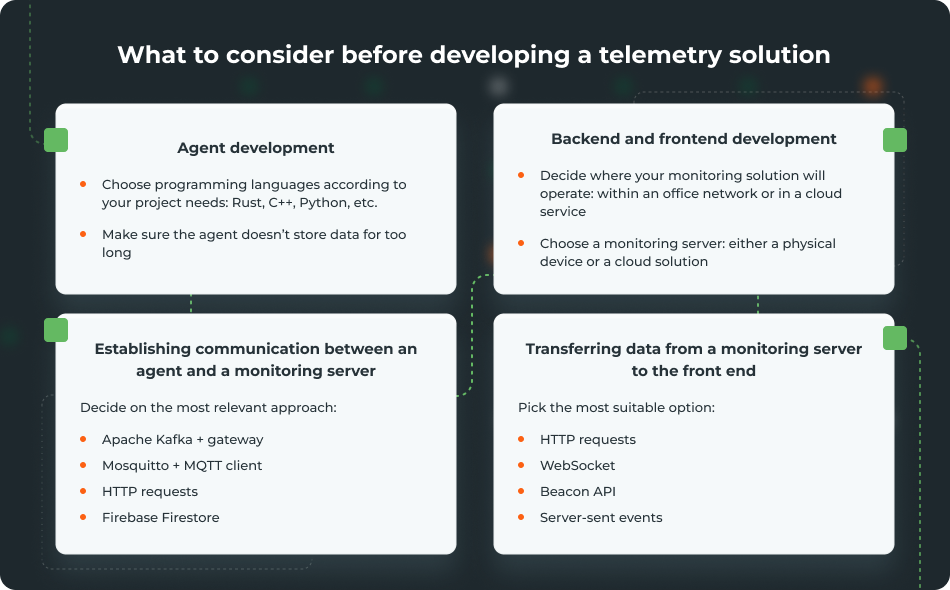
Agent development
The choice of technologies for agent development depends on the logic you want to implement in your software. You can pick almost any programming language, including:
- Golang
- Rust
- Python
- C/C++
- Java/Kotlin
Pro tip: In our experience, it’s better to use Rust and/or C++ to achieve the maximum performance with minimum cost and effort.
Keep in mind that an agent shouldn’t store data for too long, as doing so can negatively affect a server’s work.
Whether you install an agent on a server, an office desktop computer, a laptop, or some other type of device, you will encounter storage, CPU, and memory limitations. Thus, make sure your team either configures automated cleaning of historical data or uses an external device or service to store this data.
Backend and frontend development
The back end and front end of a solution that processes and shows telemetry data can be placed either within your network (on office servers, for example) or in the cloud. The optimal choice depends on your security requirements and network type (open or closed):
- If you need to collect data from computers in one office, you can sufficiently limit or even deny access to the internet. In this scenario, the network is closed and you can arrange monitoring using one of your own servers.
- If you have servers in different offices, it’s likely they will be in private networks and have access to the internet. In this case, it’s better to collect telemetry data via the cloud. A cloud service will also help you relatively easily scale capacity if you need to add more servers.
Also, you’ll need to ensure you have a monitoring server. The two most common options for implementing a monitoring server are:
- Adding a separate server or an IoT device to a work network. This server or device will collect data on vulnerabilities.
- Using a cloud instead of a physical device. A cloud service will also store data on vulnerabilities, but in this case, you’ll need to arrange access to the internet, a VPN service, etc.
Establishing communication between an agent and a monitoring server
We suggest choosing from the following options:
1. Apache Kafka + gateway
Apache Kafka is a distributed platform you can use to collect and process events. This is how it works:
- An agent acts as an event producer and sends events to a Kafka broker.
- The Kafka broker stores the received events.
- A consumer on a monitoring server pulls and processes each event.
Your team can create scripts in Rust, Node.js, Python, or Go to act as Kafka consumers and read events from Kafka. Kafka saves events in store until the subscribe service processes them. Thus, Kafka allows you to scale the monitoring server if the number of events grows, as well as to start and stop the monitoring server without losing data.
Using a publish/subscribe service like Apache Kafka with a gateway is a fairly powerful and controlled way to work with telemetry. With this approach, your team can:
- Establish a reliable, scalable streaming system for a large and busy project
- Process millions of events per second, with multichannel reliability
- Keep an eye on everything, with no events lost
The only downside is that this approach requires technical infrastructure and brings some configuration difficulties.
2. Mosquitto + MQTT client
Message Queuing Telemetry Transport (MQTT) is a lightweight publish/subscribe messaging protocol optimized for low-bandwidth and resource-constrained networks. It usually consists of:
- A service that sends messages
- A server that receives messages and distributes them to subscribers
- A client that subscribes to specific topics and receives messages in real time
Mosquitto is a popular open-source MQTT broker for sending, receiving, and forwarding messages among devices.
MQTT works the same way as Kafka but stores events for a shorter period of time (usually minutes to hours, not days to weeks like Kafka). This approach works best for cases when your solution needs to process events in real time without delays, such as for IoT systems like smart home solutions.
3. Alternative options
- HTTP requests are a common way to send data to a monitoring server. Your team can easily scale and integrate this approach with different products and systems. However, HTTP requests demand 100% availability of a monitoring server that processes requests. If the connection is interrupted, messages will be lost.
- Firebase Firestore allows you to send data directly to the event database. Your team can use this approach to both store and stream data. However, it’s only suitable for small to medium-sized projects, not for large projects requiring high-frequency telemetry.
Read also
Why and How to Collect Telemetry Data on macOS Using Apple’s Endpoint Security
Find out how to correctly integrate Apple’s Endpoint Security (ES) framework so your solution works efficiently on macOS. Explore two ways to implement this framework, along with practical tips and code examples.

Transferring data from a monitoring server to the front end
It’s also crucial to make sure a monitoring server efficiently handles and transfers data to the front end. Let’s overview four common ways to ensure that.
| Approach/protocol | Pros | Cons |
|---|---|---|
| 1. HTTP requests | ✅ Simple to implement ✅ Suitable for a relatively small number of requests and small amounts of received data | ❌ Don’t guarantee real-time data reception, meaning data may be received with a delay ❌ Data is only requested by client/application |
| 2. WebSocket | ✅ Updates occur in real time ✅ Two-way communication, meaning the client can filter data | ❌ Heavy infrastructure and specific settings ❌ Need for traffic control |
| 3. Beacon API | ✅ Doesn’t block page closing and transitions ✅ Beacons are more reliable than fetch() during page unload events | ❌ Small data volume: ~64–256 KB ❌ Can only send data, not receive it |
| 4. Server-sent events (SSE) | ✅ Easy to configure (works over HTTP) ✅ Supports automatic reconnect | ❌ Unidirectional, as only client/application receives data ❌ Not suitable for a large number of events and frequent message sending |
HTTP requests
This is a standard approach to transfer data, where a client (application):
- Initiates a request (like
GET) - Receives a response
HTTP requests are simple to implement and are suitable for a small number of requests and small amounts of received data. Your team can use this approach for projects such as simple web products with dashboards.
On the downside, HTTP requests don’t guarantee real-time data reception. Also, you can initiate an HTTP request only when loading the page. For large volumes of data ー which is usually the case with telemetry ー your request will take a long time to execute and will load the server. Another issue is that data will be relevant only when the page initially loads.
Note: To fix the issues we mentioned above, your team can add polling, which sends regular requests to the server. For example, you can arrange to send one request every 30 seconds while a user is on the page. Though this will help you get up-to-date information, it spams the server. In turn, this may necessitate a more powerful server or switching to another approach.
WebSocket
WebSocket is a protocol for persistent two-way communication between a client (application) and a server. Here’s how it works:
- The client opens a connection.
- The server sends telemetry events in real time as they occur.
- The client receives events and immediately renders them on the page.
WebSocket establishes only one connection — not many, as with HTTP requests — and this connection is persistent. With this approach, updates occur in real time and you achieve two-way communication.
However, when using WebSocket, your team will have to deal with heavy infrastructure and specific settings. Also, your engineers will need to develop and implement all traffic control logic by themselves.
Beacon API
Browsers have a built-in navigator.sendBeacon() method that allows them to send small amounts of data (~64–256 KB) to the server before closing the page. This method is asynchronous, doesn’t block transitions to another page, and doesn’t cause delays in the UX.
The Beacon API doesn’t wait for a request to be sent. Instead, it adds a request to the queue and the browser itself sends the request to the server.
Compared to the usual fetch (HTTP request), this approach looks like a better option. For example, it’s more stable during events like unload or visibility change. On the downside, Beacon API only supports the POST method (i.e. it is only suitable for sending and not receiving data) and has a limited payload.
Server-sent events (SSE)
In this approach, a server sends data to a client/application via a regular HTTP connection. This approach only has a one-way flow (server to client), unlike WebSocket, where the flow is bidirectional.
Here’s how the SSE approach works:
- A client initiates a connection via EventSource.
- The server returns a stream with the
Content-Type: text/event-streamheader. - The connection remains open, and the server periodically sends data.
- The client/application automatically processes the received data.
The SSE approach is easy to configure (it works over HTTP), and it supports automatic reconnects. However, it’s unidirectional, as only the client receives data. Also, this approach isn’t suitable for a large number of events and frequent message sending.
Now, let’s move to a practical example of how to develop a telemetry data collection system.
Read also
Establishing Network Observability: Benefits, Use Cases, Practical Tips
Improve your system monitoring with practical insights into network observability. Learn how to gain better visibility and control of your infrastructure.

Let’s build a solution for collecting telemetry data
In this section, we’ll create a simple solution that shows how to collect telemetry data, monitoring data on CPU and RAM.
We’ll use a separate physical server as a monitoring server. Also, we’ll create a simple agent using Rust and install it on the server we want to collect data from. This agent will check the server for vulnerabilities and transfer data to our cybersecurity solution.
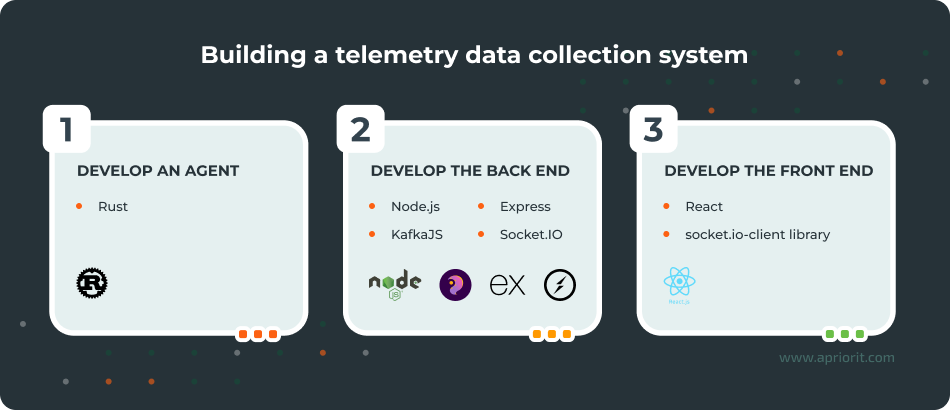
1. Start by creating a simple agent:
use kafka::producer::{Producer, Record, RequiredAcks};
use sysinfo::{System, SystemExt, CpuExt};
use serde_json::{json, Value};
use std::time::{Duration, Instant};

fn main() -> Result<(), Box<dyn std::error::Error>> {
  let broker = "localhost:9092";
  let topic = "system-metrics";

  let mut producer = Producer::from_hosts(vec![broker.to_owned()])
    .with_ack_timeout(Duration::from_secs(1))
    .with_required_acks(RequiredAcks::One)
    .create()?;

  let mut sys = System::new_all();
  let start = Instant::now();

  loop {
    sys.refresh_all();

    let cpu_usage = sys.global_cpu_info().cpu_usage();
    let used_memory = sys.used_memory() as f64 / 1024.0 / 1024.0; // MB
    let total_memory = sys.total_memory() as f64 / 1024.0 / 1024.0; // MB

    let metrics: Value = json!({
      "timestamp": start.elapsed().as_secs(),
      "cpu_usage": cpu_usage,
      "used_memory_mb": used_memory,
      "total_memory_mb": total_memory
    });

    let message = metrics.to_string();
    let record = Record::from_value(topic, message.as_bytes());

    producer.send(&record)?;
    println!("Sent: {}", message);

    std::thread::sleep(Duration::from_secs(5));
  }

  // This line will never be reached but is included for completeness
  #[allow(unreachable_code)]
  Ok(())
} Here’s what this code does:
- Collects system metrics using the
sysinfocommand - Serializes system metrics in JSON using the
serde_jsonfunction - Sends system metrics to Kafka via producer
- Repeats these steps every five seconds in an infinite loop
2. Next, let’s create a code template for the server, using Node.js along with KafkaJS, Express, and Socket.IO dependencies:
const { Kafka } = require('kafkajs');
const express = require('express');
const http = require('http');
const { Server } = require('socket.io');

const app = express();
const server = http.createServer(app);
const io = new Server(server, {
cors: { origin: '*' },
});

// KafkaJS client setup
const kafka = new Kafka({
  clientId: 'system-metrics-consumer',
  brokers: ['localhost:9092'],
});

const consumer = kafka.consumer({ groupId: 'metrics-group' });

const run = async () => {
  await consumer.connect();
  await consumer.subscribe({ topic: 'system-metrics', fromBeginning: false });

  await consumer.run({
    eachMessage: async ({ message }) => {
      try {
        const value = message.value.toString();
        const data = JSON.parse(value);
        io.emit('system-metrics', data);
      } catch (err) {
        console.error('JSON parse error:', err);
      }
    },
  });
};

run().catch(console.error);

// Clean shutdown
process.on('SIGINT', async () => {
  console.log('Disconnecting Kafka consumer...');
  await consumer.disconnect();
  process.exit();
});

server.listen(3000, () => {
  console.log('Server is running on port 3000');
}); Here’s what this code does:
- Launches an HTTP server from the WebSocket (Socket.IO)
- Creates a Kafka Consumer called KafkaJS
- Subscribes to the system-metrics topic
- Receives messages from Kafka and parses them into JSON objects
- Transfers messages to the solution’s front end in real time
3. Finally, we have to create a code template for the front end of our solution. To do that, let’s use React and the socket.io-client library:
import React, { useEffect, useState } from 'react';
import { io } from 'socket.io-client';

const socket = io('http://localhost:3000');

function App() {
  const [metrics, setMetrics] = useState(null);

  useEffect(() => {
    socket.on('system-metrics', (data) => {
      setMetrics(data);
    });

    return () => {
      socket.off('system-metrics');
    };
  }, []);

  return (
    <div style={{ fontFamily: 'Arial', padding: '2rem' }}>
      <h1>System Metrics</h1>

      {metrics ? (
        <div style={{ fontSize: '1.2rem' }}>
          <p>
            <strong>Time:</strong> {metrics.timestamp}s
          </p>
          <p>
            <strong>CPU:</strong> {metrics.cpu_usage.toFixed(2)}%
          </p>
          <p>
            <strong>Used:</strong> {metrics.used_memory_mb.toFixed(2)} MB
          </p>
          <p>
            <strong>Total:</strong> {metrics.total_memory_mb.toFixed(2)} MB
          </p>
        </div>
      ) : (
        <p>Waiting for data...</p>
      )}
    </div>
  );
}

export default App;Here’s what this code does:
- Connects to the WebSocket service using Socket.IO
- Listens for system-metrics events
- Shows CPU and RAM metrics in real time on the dashboard
Results: Above, we’ve shown you a basic concept for collecting and using telemetry data. Such an approach allows us to understand the logic of working with a data flow. Creating a full-scale solution for a real-life project requires a lot more work.
For a full-scale monitoring system with telemetry data collection functionality, your team needs to take numerous factors into account. Among other things, it’s crucial to clearly answer questions such as these:
- How many servers do you want to monitor?
- How often should agents send data?
- What data will agents send (what types and size limits)?
- How many monitoring servers should your system be able to work with?
- How many operators do you need for work with telemetry data monitoring?
- Should your system store data? If yes, for how long?
- Must your system handle temporal connection losses?
Conclusion
Collecting and processing telemetry data is crucial for businesses looking to secure their environments and for cybersecurity software providers. Telemetry solutions help organizations collect data on how systems, devices, and programs operate, significantly enhancing their cybersecurity posture and allowing them to mitigate threats early.
However, telemetry integration is rather complicated. You need professional engineers on your side who can carefully choose a fitting technology stack, plan reliable infrastructure, and overcome pitfalls during development.
Delivering a reliable and comprehensive security monitoring solution for telemetry data collection and analysis also requires expertise and experience with network development. This includes knowledge of how data is transferred within a network and pros and cons of different protocols for data exchange.
Apriorit’s specialists in cybersecurity software and network management system development will gladly assist you with tasks and projects of any complexity, from telemetry data collection to SIEM integration and real-time alerting. We can also improve SIEM solutions with big data analytics and other advanced technologies.
We have experience with:
- Building monitoring systems that grow from MVP-size projects to comprehensive cybersecurity platforms
- Establishing telemetry data collection for security products that support macOS
- Optimizing network performance for enhanced security and a better user experience
- Establishing network observability to help businesses increase efficiency
- Developing observability systems that make IT products more reliable and optimize resource consumption
Ensure efficient telemetry data collection and analysis!
Apriorit engineers will develop a reliable and scalable cybersecurity solution tailored to your business needs and technical requirements.
FAQ
What is telemetry in cybersecurity?
Telemetry in cybersecurity means collecting and analyzing data from different systems and components: networks, endpoints, applications, cloud services, etc. The goal is to monitor activities, spot anomalies, and detect threats in real time. As a result, telemetry allows organizations to quickly find suspicious activity and respond before damage occurs.
What is telemetry data in cybersecurity?
Telemetry data in cybersecurity is information gathered from networks, devices, and applications. It usually includes various logs, events, and metrics.
What is the difference between telemetry and observability?
Telemetry is more about collecting data, while observability focuses on making sense of that data to understand the system’s behavior and state. Both are essential for managing complex systems and provide real-time insights, help troubleshoot issues, and improve performance.
What telemetry data should you collect?
<p>The answer depends on your goals, needs, and project specifics. Most commonly, organizations choose to collect:</p>
<ul class=apriorit-list-markers-green>
<li>User data like login/logout times, file access, application usage patterns, and command execution histories</li>
<li>Information on application performance, error reports, and resource utilization</li>
<li>Data about network traffic patterns, bandwidth use, and device performance</li>
<li>Security telemetry data gathered from firewalls, antivirus software, and various security devices</li>
</ul>
What are the biggest challenges in implementing telemetry-driven security monitoring?
<p>This may vary depending on your project goals, enabled technologies, and current infrastructure. However, for most projects, the biggest challenges to expect include:</p>
<ul class=apriorit-list-markers-green>
<li>Scaling data pipelines</li>
<li>Ensuring data quality and security</li>
<li>Protecting sensitive telemetry data</li>
<li>Ensuring real-time (or near real-time) data processing</li>
<li>Integrating telemetry across environments</li>
</ul>
Have a question?
Ask our expert!
VP of Innovation and Technology, Canada Branch Director


