 Skip to main content

Key takeaways:
- The right combination of reverse engineering tools and methodologies streamlines analysis, minimizes errors, and ensures your team uncovers issues early during reversing.
- IDA Pro, Ghidra, and Radare2 are commonly used for static analysis and disassembly.
- x64dbg and Frida support dynamic debugging and runtime instrumentation.
- Wireshark and Fiddler help analyze network traffic and application communication.
- AI tools can speed up routine tasks, but their output must be reviewed manually to ensure accuracy.
- Experienced reverse engineers are essential for correctly interpreting low-level data and delivering reliable results.
Reverse engineering (or reversing) helps you discover the inner workings of your software, fill in gaps in your documentation, and find weak spots in your code. But to get correct and meaningful results, reversing requires both a deep understanding of how software works and careful selection of the right tools.
At Apriorit, we have over 20 years of experience in reverse engineering. Our researchers have tested and selected the most efficient reverse engineering tools, and now we would like to share our list with you.
In this article, we describe the main reverse engineering programs we rely on in our work and show practical examples of how to use them. This article will be useful for business and technical leaders who require deep reverse engineering expertise for their software product.
Contents:
Apriorit’s top reverse engineering tools
It’s hard to name the best software for reverse engineering. There are quite a few options, and each tackles a specific task in the multistep reversing process.
- Static analysis tools allow reverse engineers to disassemble unknown files and examine their code without executing them. This helps them understand the structure of software and detect potential vulnerabilities.
- Portable executable (Windows) analysis tools focus on understanding how an application behaves after launch, providing insights into its dependencies, execution flow, and modifications to system resources.
- Dynamic analysis tools allow researchers to observe a program in action, tracking its runtime behavior, system interactions, and potential security risks.
- Network traffic analysis tools monitor and dissect communication between applications, revealing data exchanges, API calls, and potential vulnerabilities in network protocols.
Below, we overview the main tools used for different reverse engineering tasks by Apriorit researchers:
Table 1. Comparison of top reverse engineering tools
| Tool | Best for | Supported platforms | Licence | Key strengths |
|---|---|---|---|---|
| IDA Pro | Deep binary analysis and disassembly | ▫️Windows ▫️Linux ▫️macOS | 💰Commercial | Advanced disassembler, large plugin ecosystem |
| ImHex | Binary inspection and pattern analysis | ▫️Windows ▫️Linux ▫️macOS | 🔓Open source | Visual hex editor, custom pattern language |
| Ghidra | Reverse engineering complex binaries | ▫️Windows ▫️Linux ▫️macOS | 🔓Open source | Powerful decompiler, collaboration features |
| Radare2 | Scriptable reverse engineering workflows | ▫️Windows ▫️Linux ▫️macOS | 🔓Open source | Highly customizable CLI framework |
| PEiD | Detecting packers and PE signatures | ▫️Windows | 🆓Freeware | Fast packer and compiler detection |
| Scylla | Import reconstruction and unpacking | ▫️Windows | 🔓Open source | Effective import table rebuilding |
| Relocation Section Editor | Editing relocation data in PE files | ▫️Windows | 🆓Freeware | Precise PE structure modification |
| CFF Explorer | Inspecting and editing PE structures | ▫️Windows | 🆓Freeware | Detailed PE header and section analysis |
| x64dbg | Debugging Windows applications | ▫️Windows | 🔓Open source | Powerful debugger with plugin support |
| Frida | Runtime instrumentation and hooking | ▫️Windows ▫️Linux ▫️macOS ▫️Android ▫️iOS | 🔓Open source | Dynamic instrumentation for apps and processes |
| API Monitor | Tracking API calls in Windows apps | ▫️Windows | 🆓Freeware | Detailed monitoring of API interactions |
| Wireshark | Deep packet inspection and network analysis | ▫️Windows ▫️Linux ▫️macOS | 🔓Open source | Industry-standard packet analyzer |
| Fiddler | Debugging HTTP/HTTPS traffic | ▫️Windows ▫️Linux ▫️macOS | ⚖️Free / Commercial versions | Web traffic inspection and manipulation |
In the next section, we will explore each of these tools in detail and provide an overview of the main features. Let’s get started.
1. IDA Pro
IDA Pro is one of the best software reverse engineering tools. This interactive disassembler has a built-in command language (IDC) and supports many executable formats for various processors and operating systems. IDA Pro also has a great number of plugins that can extend the functionality even further.
Key features:
- Interactive disassembly that allows you to rename functions, variables, and data structures
- Flexible data representation (numbers, strings with various encodings, structures)
- Graph views and code flow diagrams that simplify the understanding of program logic
- Integration of type information from C/C++ headers to improve code readability
- Automatic recognition of standard library functions
- Extensive plugin ecosystem for extending functionality
- Industry-standard reverse engineering platform
Pros:
- Powerful interactive analysis capabilities
- Large plugin ecosystem and strong community support
- Supports many architectures and binary formats
Cons:
- Expensive commercial license
- Steep learning curve for beginners
- Some advanced functionality requires additional paid plugins
Aside from the disassembler itself, let’s also look closer at some IDA plugins.
Hex-Rays Decompiler
This IDA plugin can turn native processor code into a more readable C-like version. Hex-Rays Decompiler produces rather accurate C code comparable to that produced by a human reverse engineer. It correctly decompiles code produced by various C++ compilers, no matter the architecture.
However, Hex-Rays Decompiler might have issues with processing complex assembler code, where the original code was specifically modified by adding the inline assembler or manual optimizations were made.
Lighthouse
This plugin enables you to mark the execution path within the disassembler. As a result, you can understand which pieces of code take part in execution and whether they are involved in an algorithm or feature.
Basically, Lighthouse loads reports from code coverage tools into the IDA database and marks pieces of code depending on how many times they were executed. This makes it clear which parts of the code are worth your attention while browsing the disassembly.
ClassInformer
This plugin is intended to be used on binaries built by Visual Studio and searches for RTTI information stored in the data section of the executable file. RTTI information allows the plugin to find class names and virtual methods of C++ classes and name them for the user. Also, ClassInformer can present you with a list of found classes.
BinDiff by zynamix
This tool uses the IDA engine to compare binaries as assembler code instead of a stream of bytes. BinDiff can pinpoint differences in the code of two versions of the same program (down to changes in a specific function) as a list of added, removed, or replaced instructions. Changes can also be represented as code flow graphs.
IDA-Function-Tagger
This plugin analyzes imported functions (and functions that call them). It then groups all of these functions by tags: cryptography-related, registry-related, network-related, etc. Such grouping makes it easier to find the part of the code responsible for specific operations.
ida-x86emu
This plugin emulates the execution of disassembled code without the need to run the application under analysis in a debugger. Using ida-x86emu, you can emulate the result of executing any piece of code without the risk of modifying something in the system. All you need to do is specify the start values of CPU registers. Then you can do a step-by-step execution.
Read also
How to Reverse Engineer Windows Software the Right Way: A Practical Example
Discover how ethical reverse engineering practices can drive innovation of Windows software, enhance product development, and uncover competitive advantages for your business.

2. ImHex
ImHex is a powerful modern cross-platform tool for inspecting, analyzing, and visualizing binary data. It’s especially useful for reverse engineers, security researchers, and developers working with binary formats because of its advanced features that exceed those of traditional hex editors.
ImHex supports its own data representation language similar to C++/Rust so you can see binary data in a convenient, structured way. It ships with some popular pattern scripts like PE, PCAP, and Mach-O, but you also can write your own patterns.
Key features:
- Custom pattern language for defining binary data structures
- Built-in patterns for common formats such as PE, PCAP, and Mach-O
- Data visualization tools, including entropy and byte distribution graphs
- Integrated disassembler supporting multiple architectures
- Advanced search capabilities for strings, byte sequences, regex, and patterns
Pros:
- Modern and intuitive interface
- Powerful binary visualization capabilities
- Cross-platform support
- Flexible pattern language for analyzing complex binary structures
Cons:
- Smaller ecosystem compared to long-established tools
- Some advanced reverse engineering tasks still require complementary tools
- Less mature disassembly capabilities compared to dedicated disassemblers
3. Ghidra
Ghidra is an open-source and cross-platform reverse engineering tool that helps users analyze binaries on many platforms (Windows, macOS, Linux). Ghidra supports a lot of popular formats such as PE, COFF, macOS, Mach-O, ELF, and DBG. It can disassemble instructions for x86, x86_64, ARM, AARCH64, and other architectures.
Key features:
- Code browser for exploring instructions, data, and program structure
- Integrated decompiler that converts binary code into readable C-like code
- Built-in debugger with pluggable connectors for third-party debuggers
- Function pattern analysis for detecting common code structures
- Script manager for automating analysis tasks and extending functionality
Pros:
- Free and open-source software
- Feature-rich decompiler comparable to commercial tools
- Cross-platform support
- Strong automation capabilities through scripting
Cons:
- Interface can feel complex for new users
- Performance may vary when analyzing very large binaries
- Plugin ecosystem is smaller than that of some commercial tools
4. Radare
The Radare disassembler has all the features of IDA and is free and open-source software — but it’s not as robust and stable. While Radare itself is a console tool, it has a Iaito front end, which makes it a true alternative to IDA and Ghidra.

Key features:
- Command-line framework for binary analysis and disassembly
- Support for multiple architectures and executable formats
- Scripting capabilities for automating analysis workflows
- Integration with graphical interfaces
Pros:
- Completely free and open-source
- Highly flexible and scriptable
- Supports many architectures and file formats
- Large community of contributors
Cons:
- Command-line interface may be challenging for beginners
- Documentation and usability can be inconsistent
- Requires more manual configuration than some alternatives
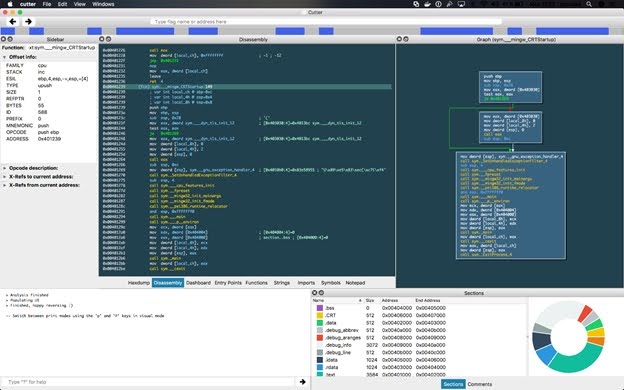
Alternatively, you can use Rizin, which is a fork of Radare2. Rizin combines the free and open-source nature of Radare2 with its own user-friendly GUI (called Cutter) and an improved decompiler, making it a potentially attractive alternative to commercial options like IDA or even Ghidra.
5. PEiD
PEiD is one of the best reverse engineering tools to detect an application’s packer. By analyzing specific signatures and characteristics, PEiD can detect whether an application is packed and which packer was used.
Key features:
- Detection of packers, cryptors, and compiler signatures
- Large signature database for identifying known protection methods
- Plugin support for extending functionality
- Simple interface for quick binary inspection
Pros:
- Fast and lightweight analysis tool
- Effective for identifying common packing techniques
- Useful first step in malware analysis and unpacking workflows
Cons:
- Focused mainly on signature-based detection
- Limited functionality compared to modern reverse engineering suites
- Primarily designed for Windows PE files
There are also various useful plugins that help to analyze PE files. For instance, the KANAL (Krypto Analyzer for PEiD) plugin analyzes a PE file for the presence of known encryption algorithms.
Read also
The Evolution of Reverse Engineering: From Manual Reconstruction to Automated Disassembling
Apply ethical reverse engineering to uncover vulnerabilities, enhance security measures, and make your product more reliable and trustworthy.

6. Scylla
Scylla is a tool for dumping a running application process and restoring the PE import table. With its help, you can get a totally restored PE file that can be run by the operating system.
Key features:
- Import table reconstruction for damaged or missing PE imports
- Memory dumping of running processes
- Support for both 32-bit and 64-bit Windows applications
- Tools for analyzing packed or obfuscated executables
Pros:
- Highly effective for rebuilding executable files from memory dumps
- Useful for analyzing packed or protected applications
- Lightweight and focused on a specific reverse engineering task
Cons:
- Limited to Windows PE file analysis
- Requires experience with memory dumping workflows
- Not intended as a full reverse engineering environment
At Apriorit, we use Scylla to analyze malware, recover lost executables from running processes, and debug software or analyze its behavior in a running state.
7. Relocation Section Editor
Relocation Section Editor is an application used for editing the relocation table in PE files. The main purpose of this tool is to modify the relocation table in case of patching relocatable pieces of code. But it’s often used to remove the relocation table altogether when restoring a protected file.
Key features:
- Editing and rebuilding of relocation tables in PE files
- Modification of relocation entries during binary patching
- Support for removing relocation tables from executables
Pros:
- Provides precise control over relocation data
- Helpful in advanced binary patching workflows
- Lightweight and focused on PE modification tasks
- Useful when restoring unpacked or dumped binaries
Cons:
- Limited functionality outside relocation table editing
- Requires deep knowledge of the PE file format
- Windows-only tool
When restoring protected files with Relocation Section Editor, reverse engineers might either reconstruct the missing relocation table or remove it entirely and specify that the executable is not relocatable in the PE header.
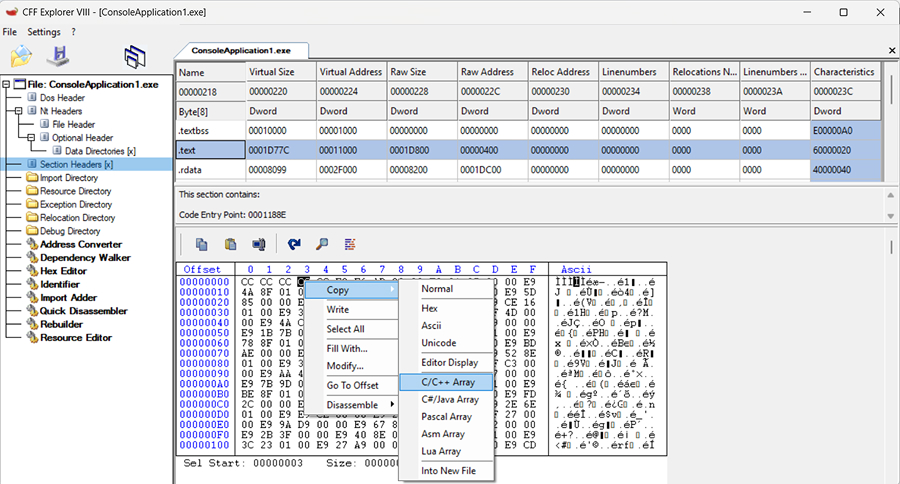
8. CFF Explorer
CFF Explorer is part of the Explorer Suite and provides a set of tools for inspecting and modifying Portable Executable files. It allows reverse engineers to analyze PE structures, edit resources, and explore dependencies inside Windows binaries.
Key features:
- Built-in PE and hex editors
- Resource and import table editors
- Signature scanner and dependency analyzer
- Address conversion utilities
- Integrated disassembler
Pros:
- Comprehensive toolkit for PE file inspection
- User-friendly graphical interface
- Useful for debugging and modifying Windows executables
Cons:
- Focused mainly on Windows PE files
- Limited dynamic analysis capabilities
- Interface may feel outdated
CFF Explorer streamlines tasks like editing PE files, debugging software, and ensuring compatibility across different systems. At Apriorit, we use it to inspect, modify, and understand executable files.
9. x64dbg
x64dbg is an open-source debugger for Windows, designed for analyzing, reverse engineering, and debugging x86 (32-bit) and x64 (64-bit) applications. It is commonly used for analyzing malware, cracking software, and understanding how applications work at a low level.
Key features:
- Interactive debugging for 32-bit and 64-bit applications
- Breakpoints, memory inspection, and disassembly views
- Ability to debug DLL files without manually loading them into processes
- Plugin support for additional debugging tools
Pros:
- Free and open-source alternative to commercial debuggers
- Clean and intuitive user interface
- Active community and plugin ecosystem
Cons:
- Limited to Windows environments
- Advanced analysis may require additional plugins
- Fewer integrated automation features compared to other reverse engineering frameworks
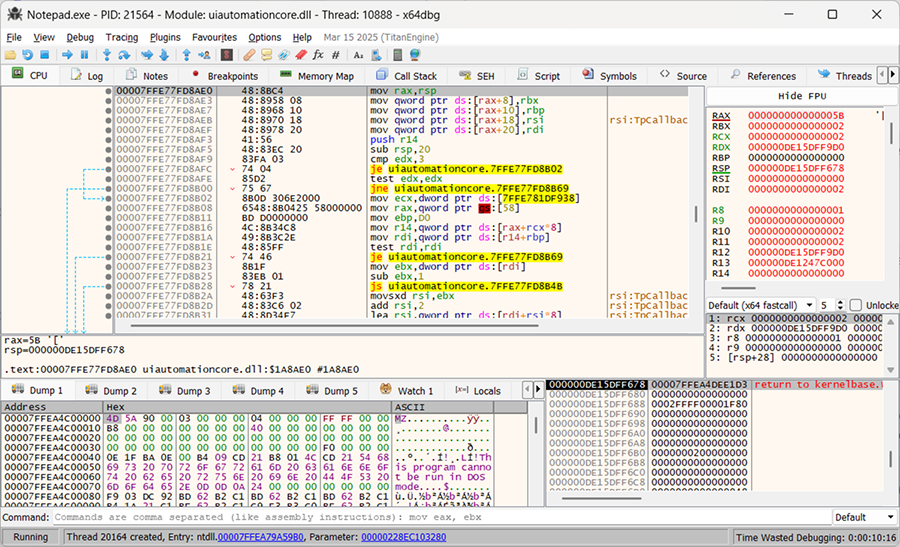
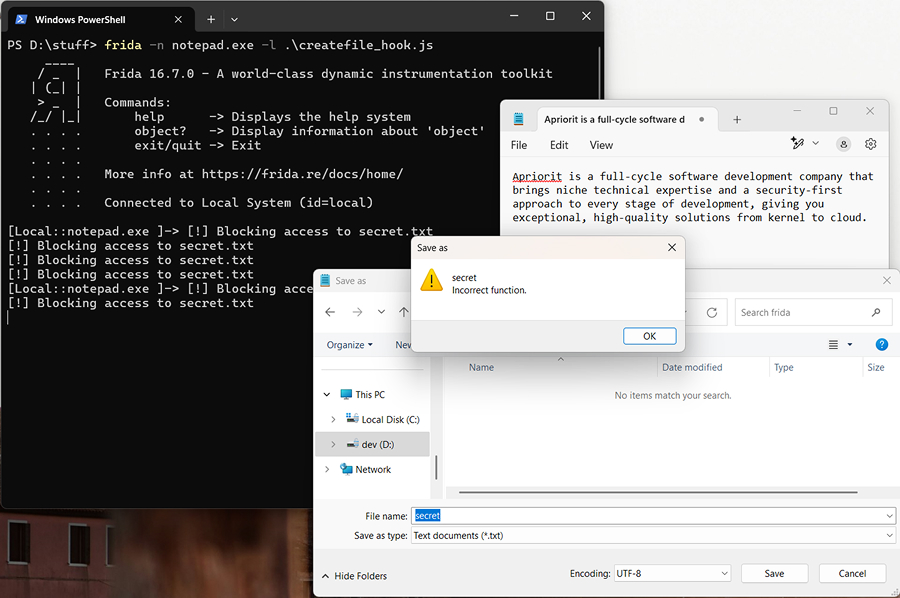
10. Frida
Frida is a dynamic instrumentation toolkit that allows you to hook into and modify the behavior of software at runtime. It is widely used for reverse engineering, security research, debugging, and application testing. You can use JavaScript and Python scripts to control the runtime of the instrumented process.
FKey features:
- Runtime instrumentation using JavaScript or Python scripts (among other languages)
- Ability to hook and trace API calls in running processes
- Function interception and modification of arguments or return values
- Support for Windows, macOS, Linux, iOS, and Android
Pros:
- Extremely powerful runtime analysis capabilities
- Cross-platform support, including mobile environments
- Flexible scripting interface for automation
Cons:
- Requires scripting knowledge to use effectively
- Setup and configuration can be complex
- Not designed as a traditional graphical reverse engineering environment
Frida allows you to monitor system API calls such as file system access, network communication, and registry operations.
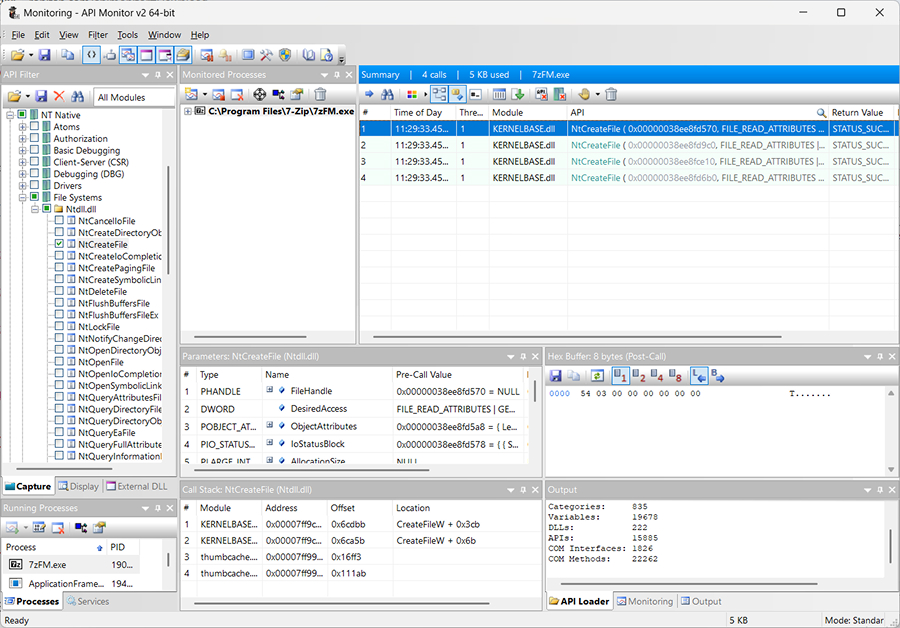
11. API Monitor
API Monitor is designed to intercept API function calls made by applications and services. It allows you to view both the input parameters and output data of these calls, making it an invaluable resource for reverse engineering API calls.
Key features:
- Monitoring of API calls from selected built-in Windows or own DLLs in running applications
- Inspection of function parameters and return values
- Built-in database containing thousands of API definitions
- Support for COM interface monitoring
Pros:
- Provides deep visibility into Windows API use
- Extensive database of predefined API signatures
- Helpful for debugging and reverse engineering Windows applications
Cons:
- Limited to Windows environments
- Primarily focused on API monitoring rather than full reverse engineering
- Interface can be complex for beginners
By default, API Monitor contains definitions for over 13,000 API functions and more than 1,300 COM interface methods, which makes it an extensive and powerful tool for analyzing and debugging software interactions with the Windows API and COM-based components.
Read also
How to Reverse Engineer an iOS App and macOS Software
Explore how reverse engineering can enhance the security and reliability of your macOS or iOS solution and ensure compliance with strict security standards.

12. Wireshark
Wireshark is a network analysis tool that allows you to capture, inspect, and analyze network traffic in real time. It also lets you work with already captured traffic (pcap files) and may help you with low-level protocol reverse engineering by capturing and analyzing traffic of an application, virtual machine, or any device that routes traffic through your machine.
Key features:
- Interception of live network packets from multiple sources
- Detailed inspection of packet headers and payloads
- Support for hundreds of network protocols
- Powerful filtering and search capabilities
- Export and analysis of captured traffic files
- Powerful filtering and visualization features
Pros:
- Industry-standard network analysis tool
- Extensive protocol support
Cons:
- Can generate large volumes of complex data
- Requires knowledge of networking protocols
- Not specifically designed for binary reverse engineering
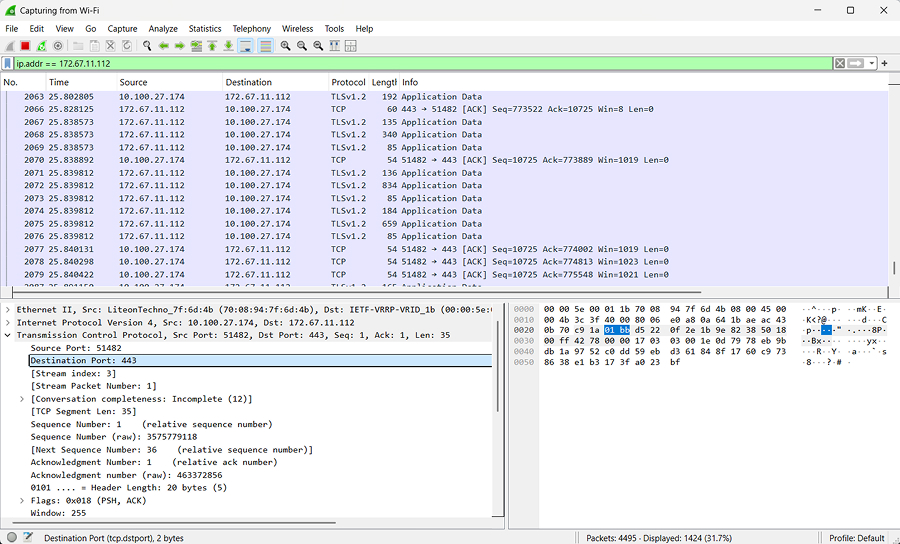
Wireshark supports capturing traffic from sources such as Wi-Fi, Ethernet, Bluetooth, and USB. It also allows reverse engineers to analyze protocols like TCP, UDP, HTTP, DNS, TLS, and IEEE 802.11.
13. Fiddler
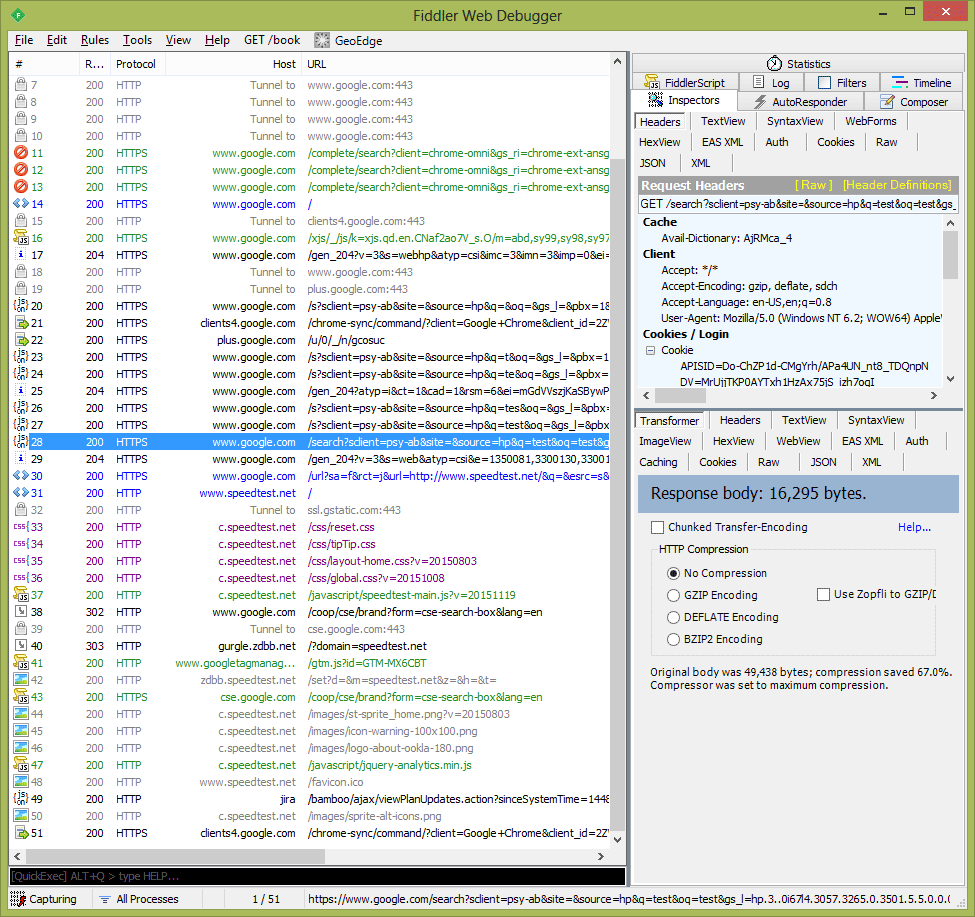
Fiddler is a proxy that you can use to intercept, monitor, and analyze HTTP/HTTPS traffic going between your application and external services or servers. Fiddler can intercept HTTP/HTTPS traffic system-wide. You can also add plugins (such as wbxml view, which can decode wbxml) and display requests/responses in different views.
Key features:
- Interception and inspection of HTTP/HTTPS traffic
- System-wide traffic monitoring through proxy configuration
- Built-in hex editor and request modification tools
- Plugin support for extended functionality
Pros:
- Excellent tool for analyzing web application traffic
- Supports request editing and replay of commands
- Flexible plugin ecosystem
Cons:
- Primarily focused on web protocols
- Requires proxy configuration in some environments
- Not ideal for low-level network protocol analysis
Fiddler has a built-in hex editor and can generate new requests based on a selected request or create a custom request. In addition, the Request to Code plugin allows you to get ready code that executes requests in C#, Visual Basic, or Python.
These are the tools that reverse engineers at Apriorit often turn to when working on Windows reversing projects. As you can see, each piece of reverse engineering software tackles a specific set of tasks. In the next section, we provide practical examples of the role and importance of each of these tools in Windows reversing.
Related project
Improving a SaaS Cybersecurity Platform with Competitive Features and Quality Maintenance
Explore how Apriorit’s skilled reverse engineers helped our client analyze and improve their complex software.

Practical example of working with non-AI reverse engineering software
Let’s see how we can use each of these tools to research a Windows application. As an example, we are going to use a test application [.exe] that you can download and analyze on your own.
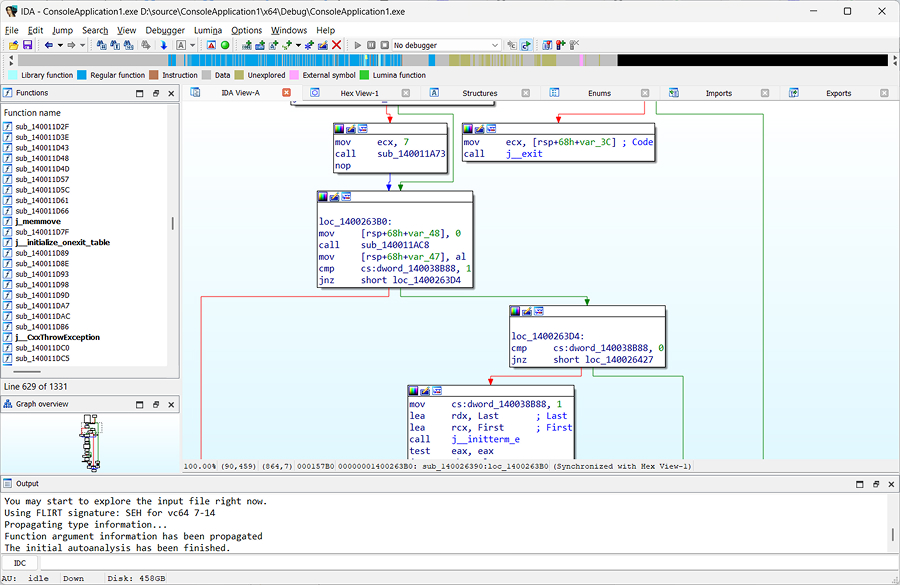
1. Open the executable to be researched with IDA Pro
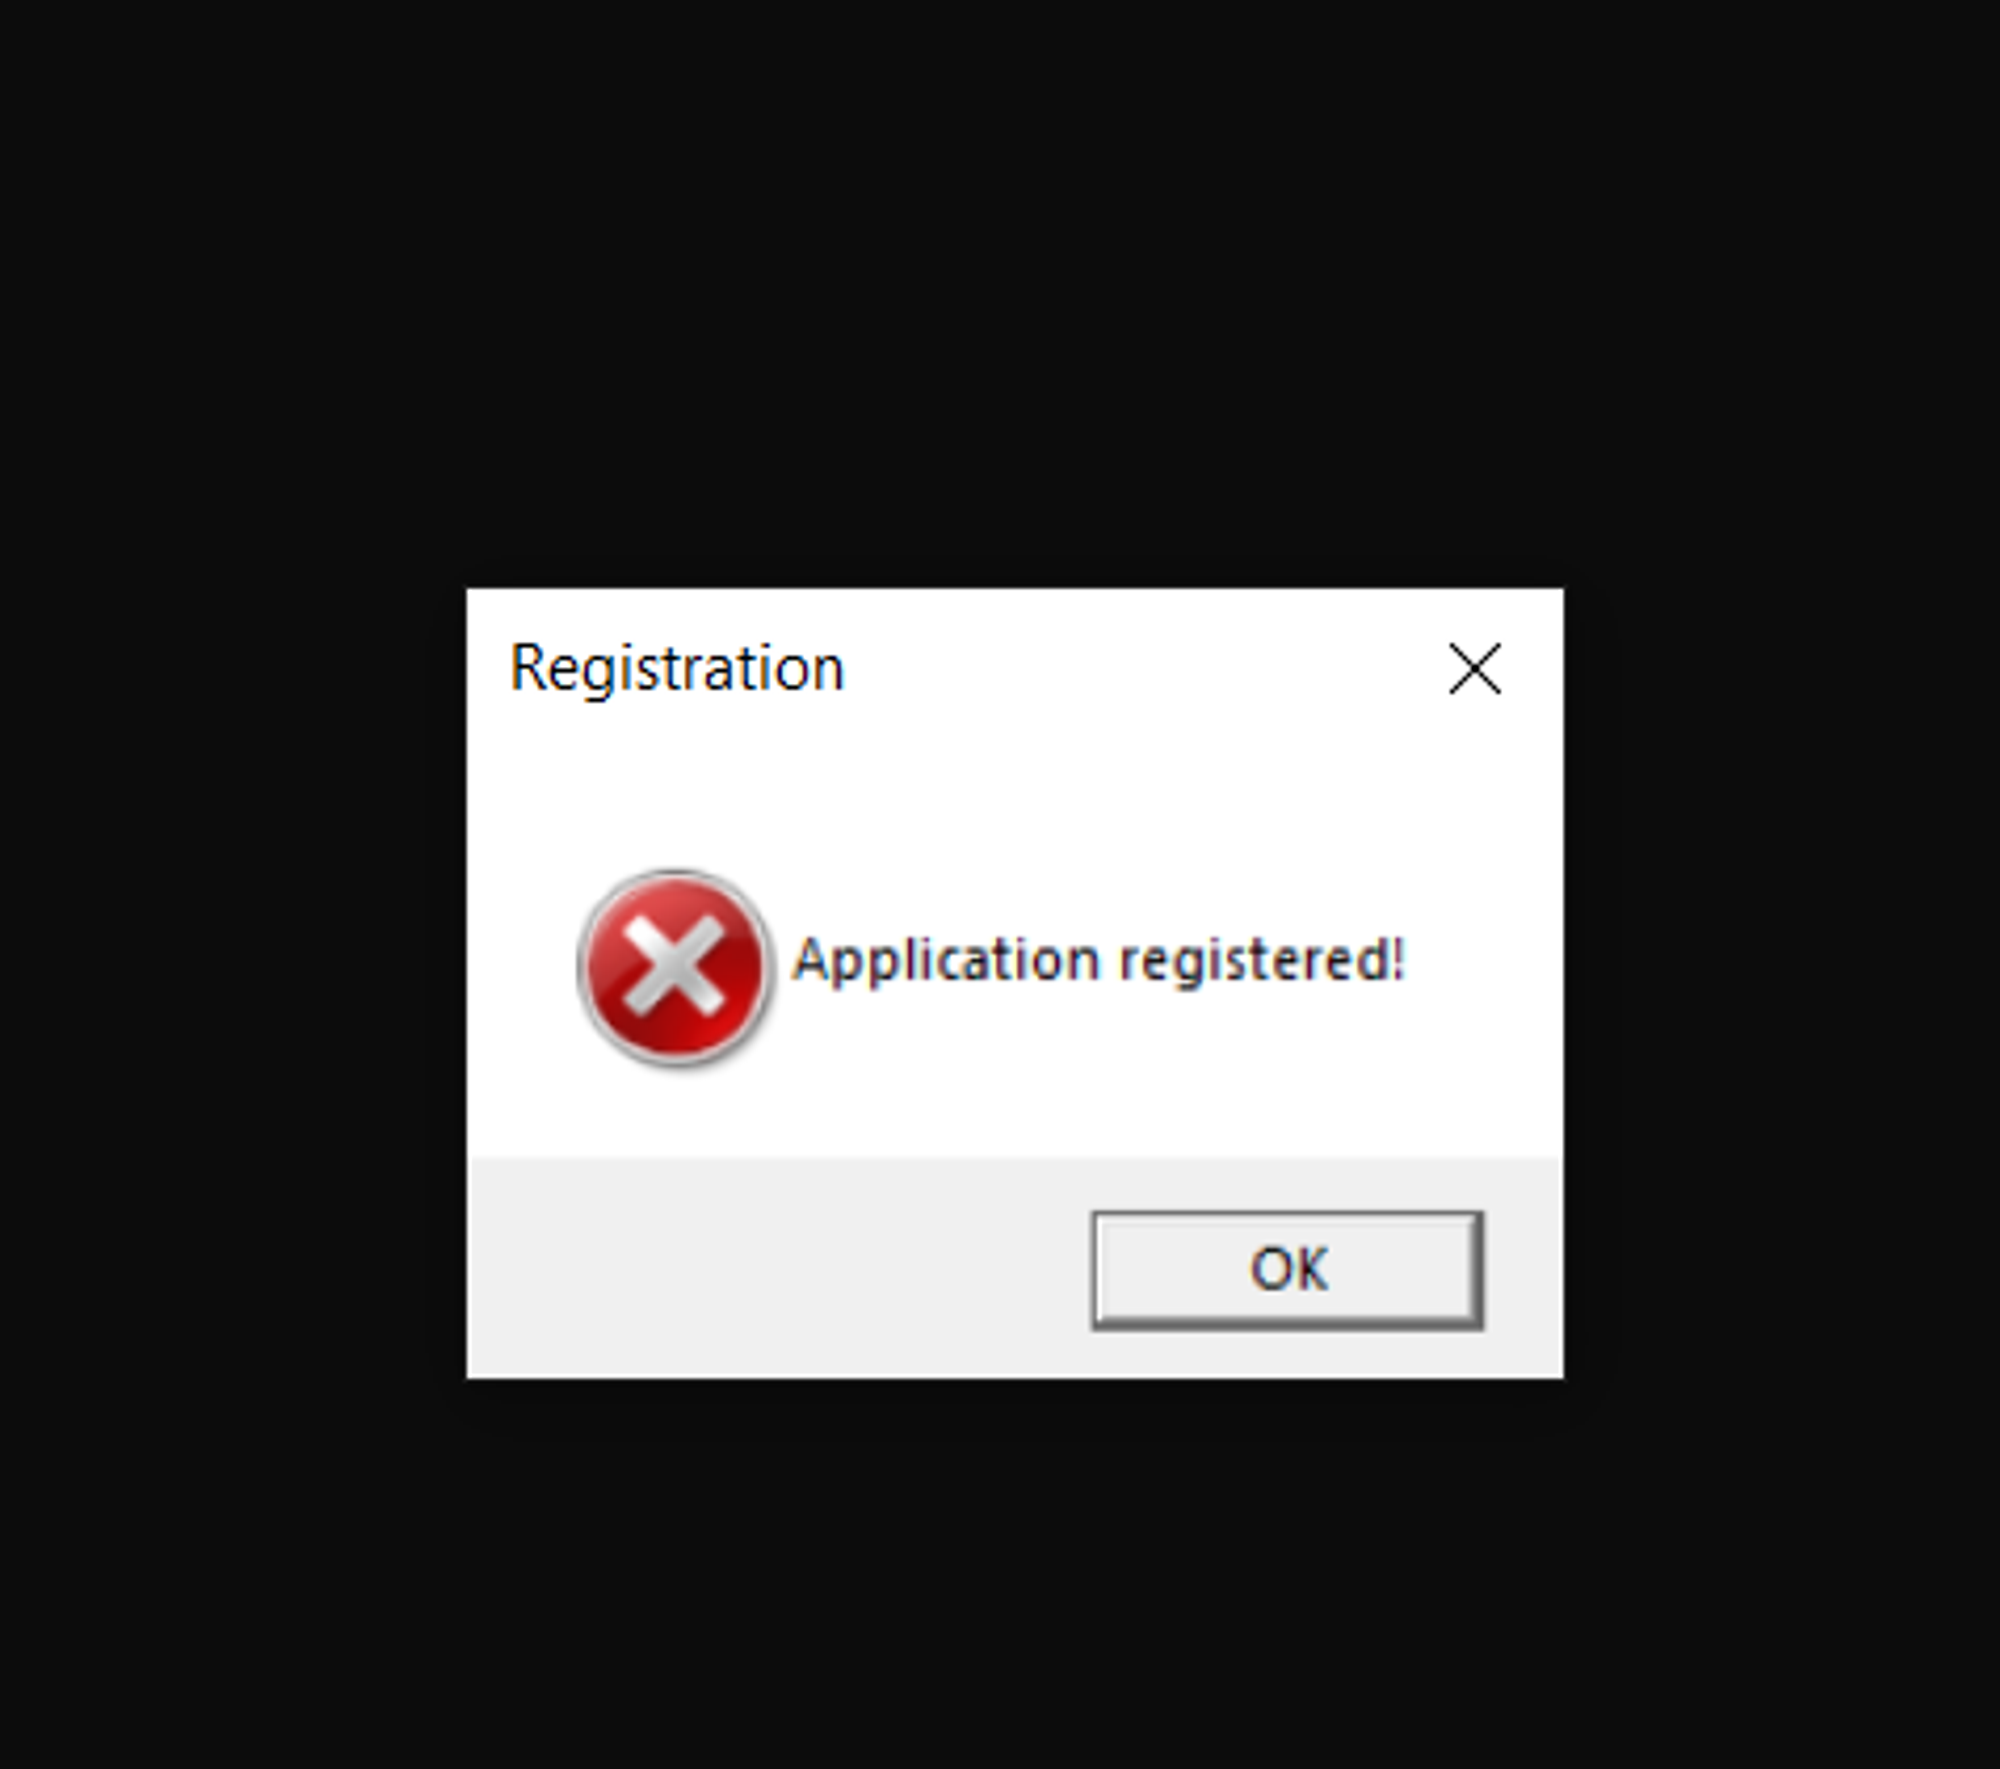
When we load our test application in IDA Pro, we receive the following message:
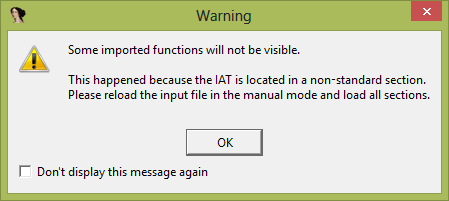
This means that something has gone wrong with the application: its import table can’t be found. At this point, we only need to choose OK. Once we do that, IDA Pro provides us with the following results of application analysis:
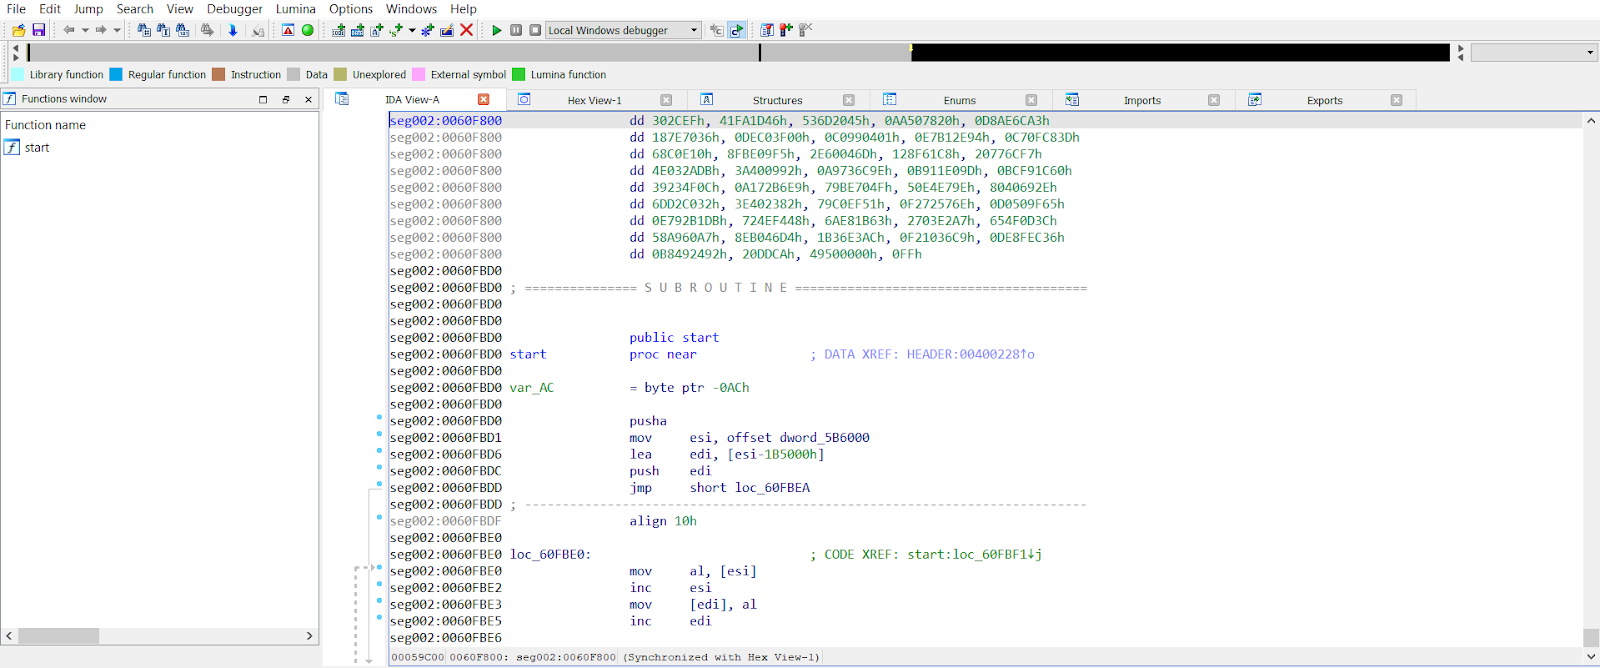
As you can see, the import table is almost empty. Its upper part shows that it was possible to detect a small piece of code (the blue part), and the left part shows which functions were detected (in our case, very few).
There is also a set of undetected bytes above the start function. We suppose that the application is packed by means of some packer. PEiD will help us determine which packer was used.
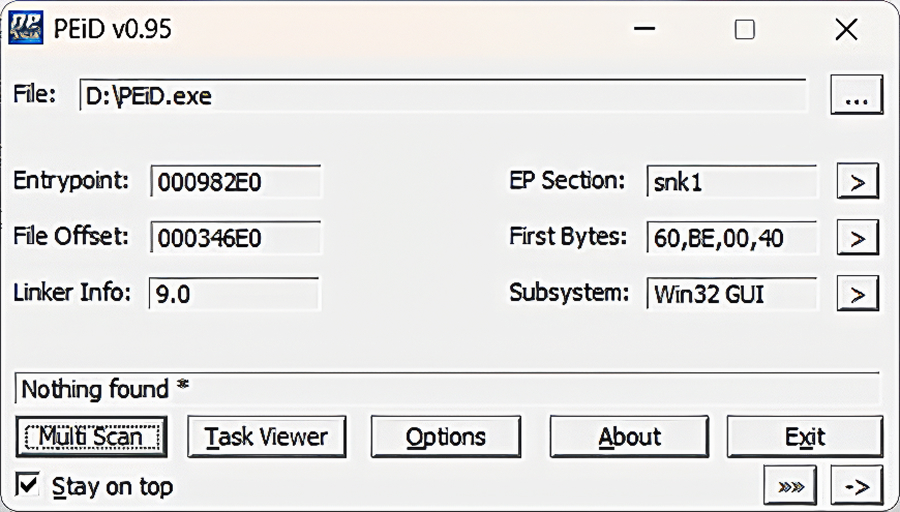
2. Get information about the packer with PEiD
Now, we need to load our application in PEiD.
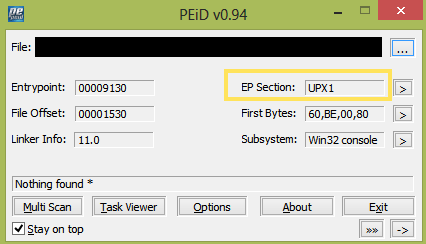
In Screenshot 19 above, you can see that the Entry Point is located in the UPX1 section. However, this fact alone doesn’t really tell us much, so we need to run a scan.
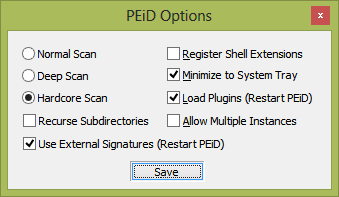
To start the scanning process, go to Options, choose Hardcore Scan, then choose Save:
Next, select the folder where the application is located. After scanning is complete, we receive the following result:
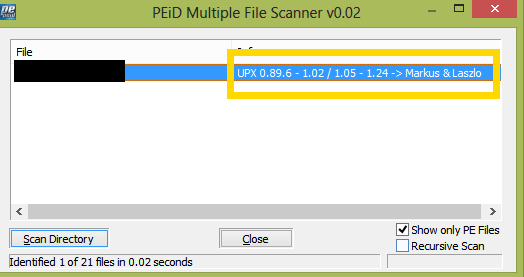
As you can see from Screenshot 21, the application is packed using the UPX tool. To unpack it, we will use CFF Explorer.
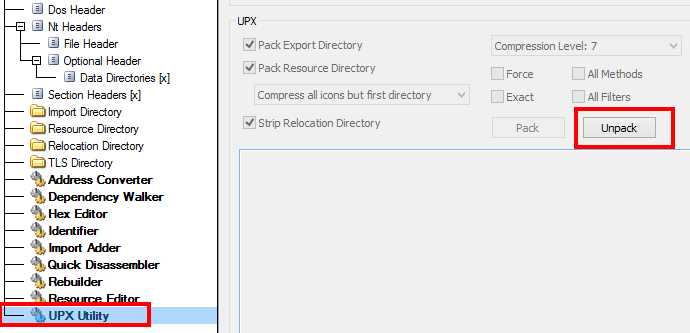
3. Unpack the application with CFF Explorer
To unpack our sample application with CFF Explorer, we need to go to the UPX Utility page in the main menu of CFF Explorer and choose Unpack:
After that, we can upload the unpacked application to IDA Pro and restore the assembler code.
When we upload our application to IDA Pro once more, the system asks us whether we want to upload symbols from the server, and we agree. Here is the result of application analysis in IDA Pro:
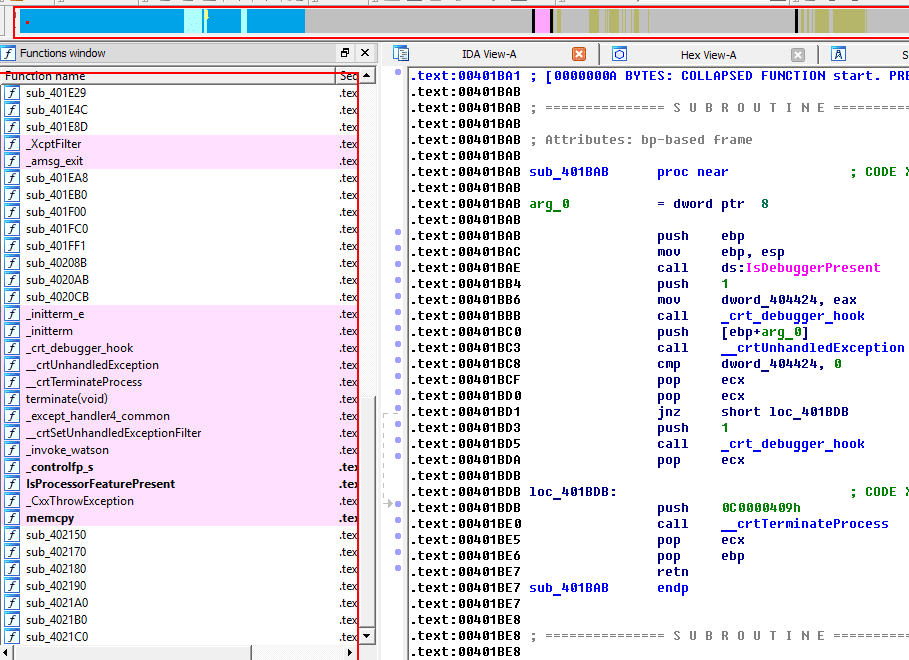
You can see in Screenshot 23 that we now have some readable code, more detected functions, and an import table (Screenshot 24). At this point, we can run the application and debug it in IDA Pro. In the disassembler, we choose Debugger > Select Debugger > Local Win32 debugger and then press F9. After that, we receive the following warning message:
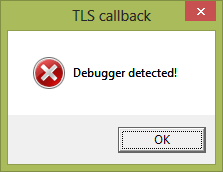
Our tested application detected that it was being debugged. To continue with our analysis, we need to disable debugger detection.
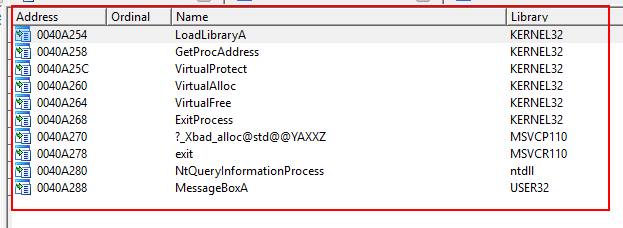
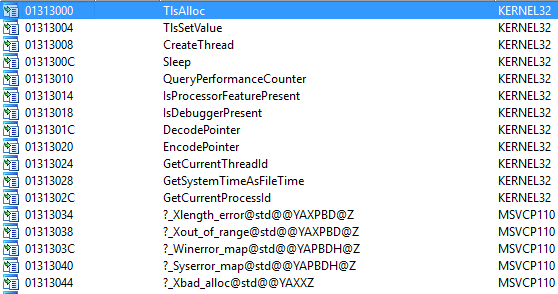
See the import table:
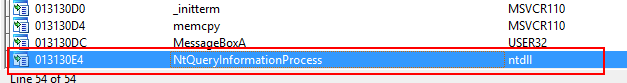
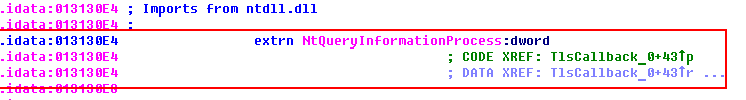
Right away, we notice the NtQueryInformationProcess function. After clicking on it, we get the following list of xref functions:
By clicking on the function, we can see where it’s called. The third parameter is an output parameter. If it equals 1, then a debugger is attached to the application; if it equals 0, there’s no debugger attached.
Let’s see where the result of this function is written:
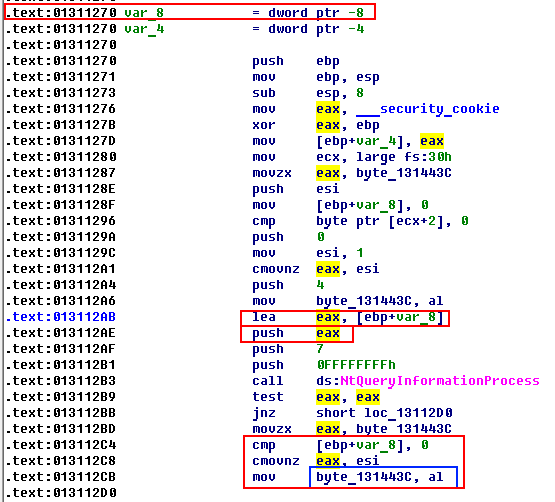
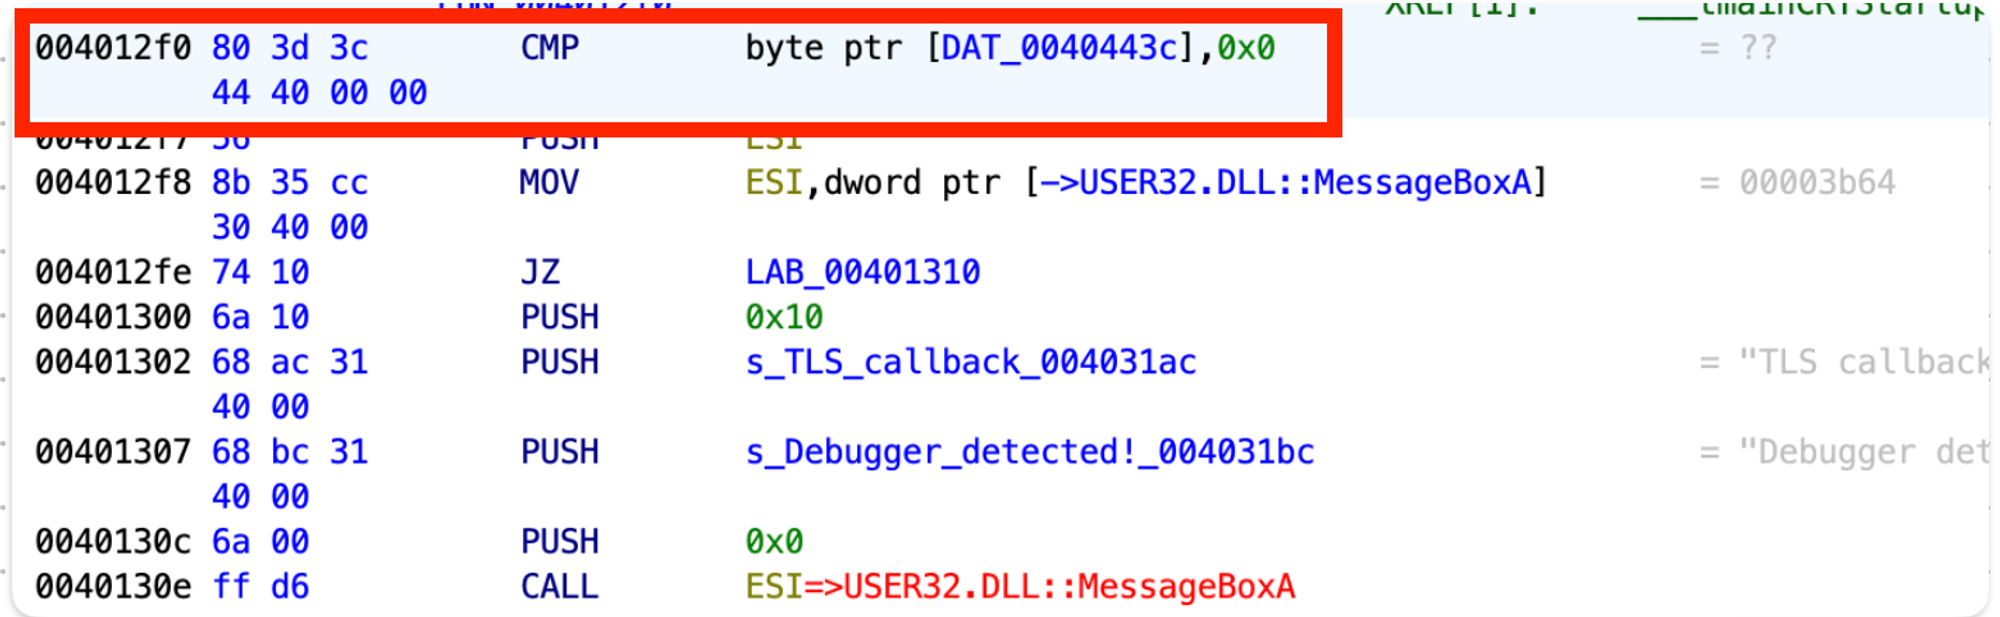
As we can see in Screenshot 28, the third parameter contains the address of the local variable (var_8). After a function call, the result of the function is checked (test eax, eax). Then the value of var_8 is checked, and if it’s not 0, the value is written to the byte_131443C variable.
Let’s check if byte_131443C is used somewhere else in this function:
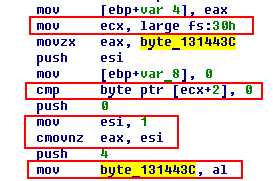
We’ll start from the end. This value contains the result from al (lower bytes). Before that, the esi result is written to eax, and 1 is written to esi. Above, we see the condition for writing 1 to esi: if ecx + 2 does not equal 0. The value in ecx is large fs:30h (+ 2). It verifies that a debugger’s presence has bypassed the IsDebuggerPresent function (a field of undocumented PEB structure).
Let’s rename this variable. To do so, press N, or right-click on the function and select Rename.
Now we need to check if the g_isDebbugerPresent variable is used anywhere else:

We see “…” at the end, so this variable is used in more than one place. Hover the cursor over the variable and click X, or right-click and select Jump to xref to operand:
We already know the first four places where this variable is used, but not the last. Let’s find it:
In Screenshot 32, we see that the variable checks if esi equals 0, and if it doesn’t, we receive the message that there is a debugger.
Luckily, this verification can be removed.
It’s noteworthy that IDA Pro also allows for patching memory and code. In order to quickly find the necessary piece of code, we’ll run the Rebase program in IDA Pro to get the same offset as in Ghidra. In IDA Pro, select Edit > Segments > Rebase program and enter the value 0x400000 in the opened window:
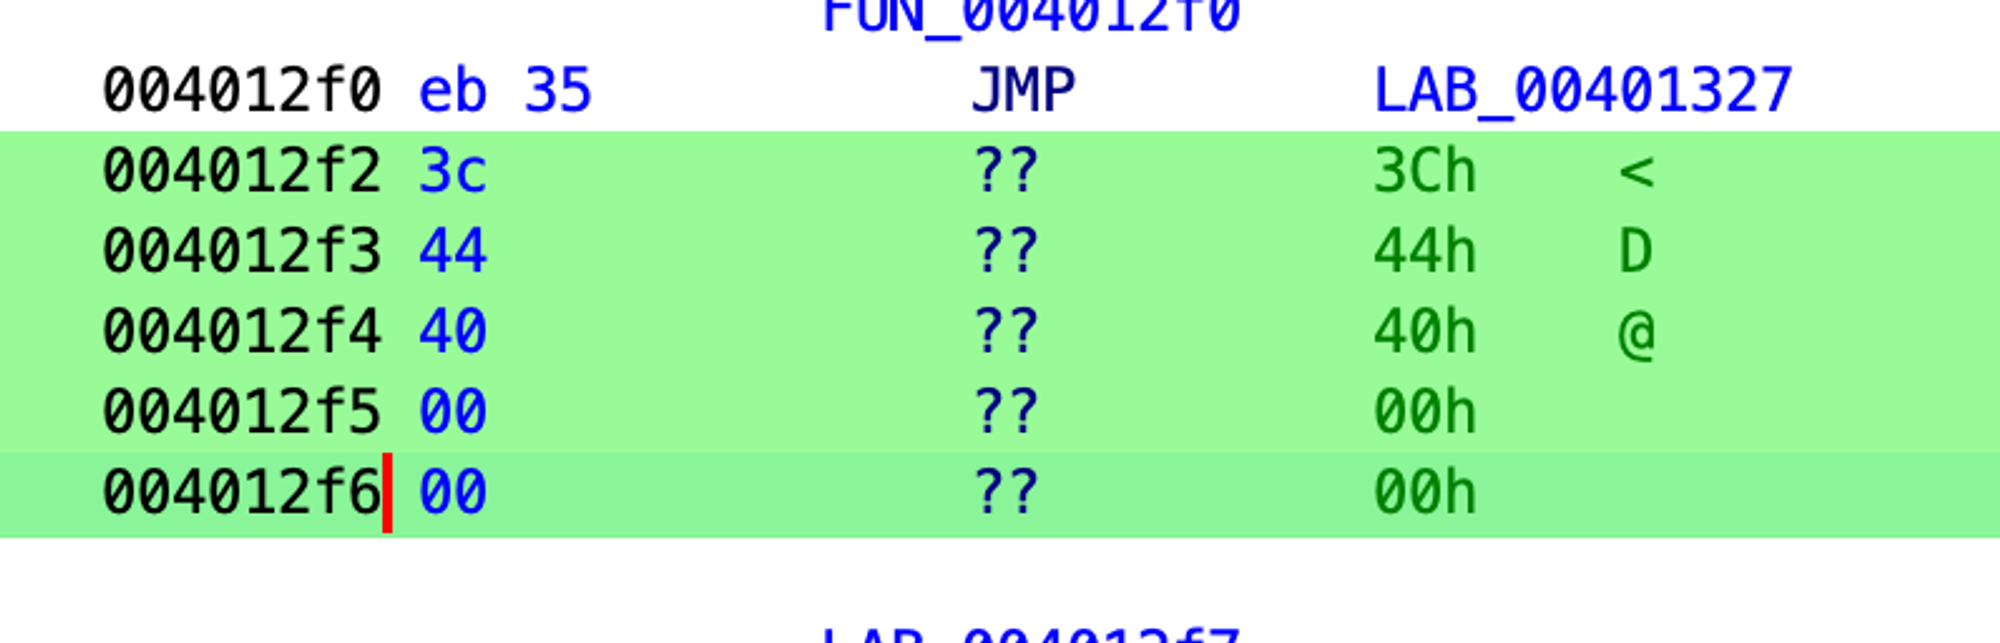
Let’s get the address of the code that performs the comparison. As you can see from Screenshot 34 below, the address is 0х4012F0:
We need to write down this address, as we are going to use it later in Ghidra.
Read also
How to Reverse Engineer a Proprietary File Format: A Brief Guide with Practical Examples
Want to enhance your product’s interoperability? Discover how to reverse engineer proprietary file formats in our comprehensive guide.
4. Modify the executed statements in Ghidra
Now we need to load our application in Ghidra. Create a project by choosing File → New Project…
Then, choose the green dragon icon in Tool Chest, which represents Ghidra’s CodeBrowser.
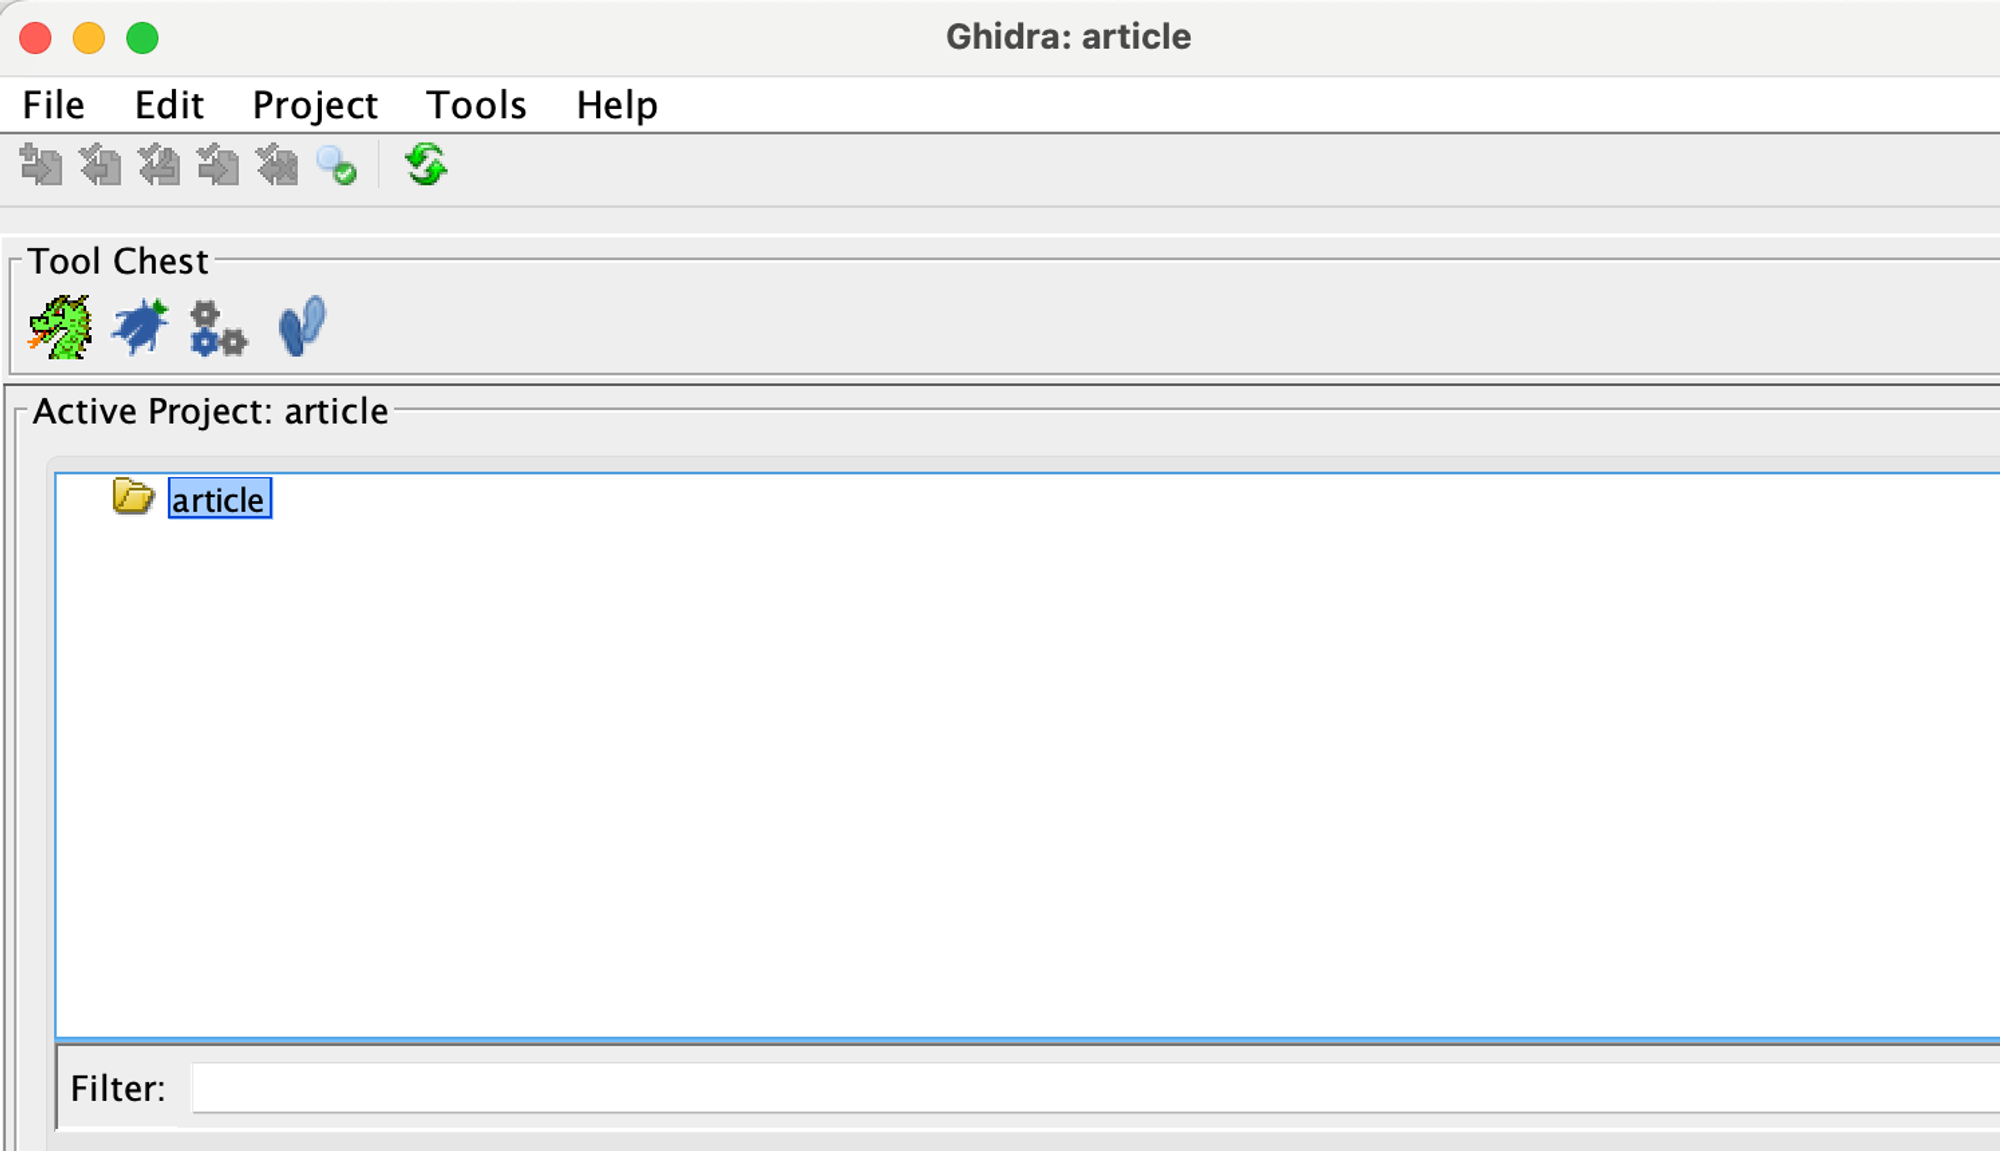
Press I to import the executable into the workspace. After that, Ghidra will suggest analyzing the executable. Choose Analyze.
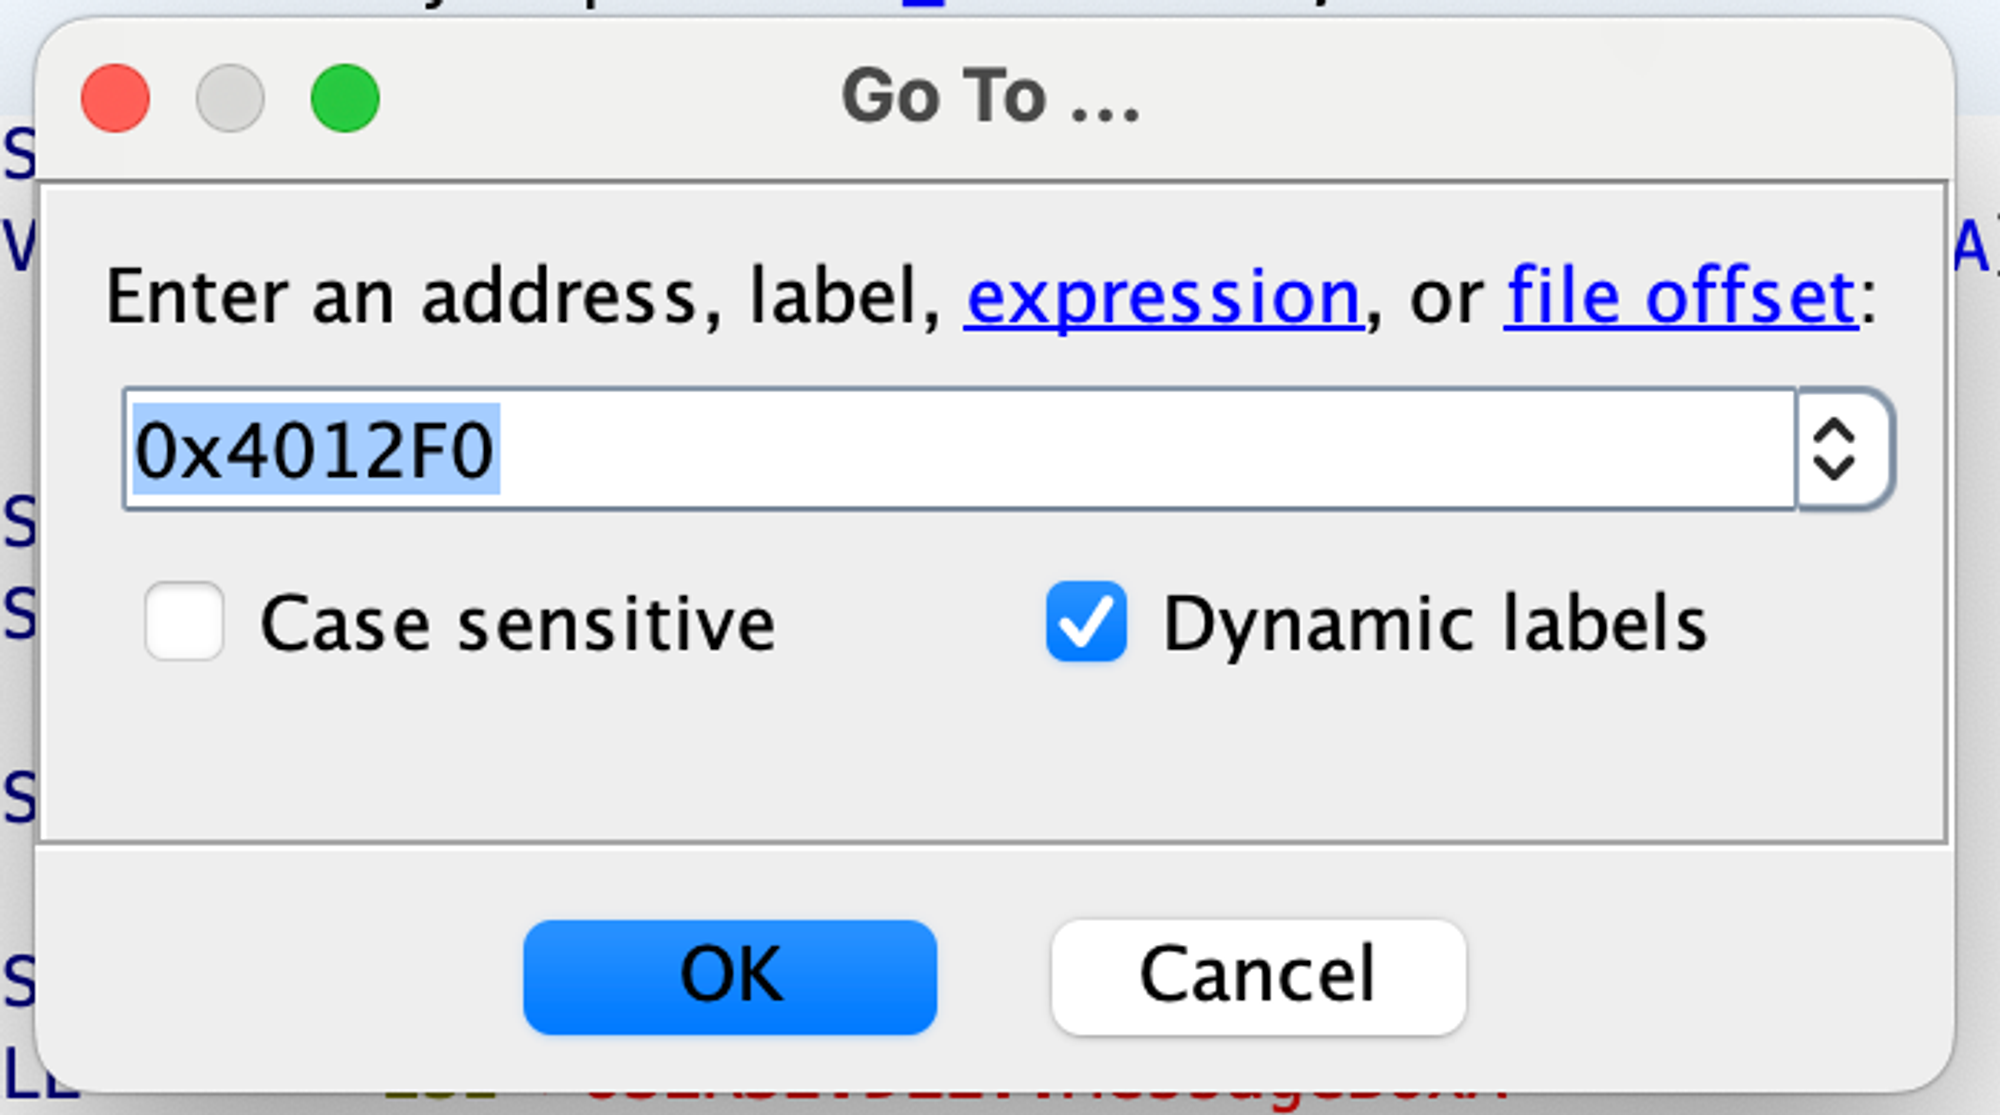
Now, let’s proceed to examine our address 0x4012F0. Press G and type the address 0x4012F0 into the box:
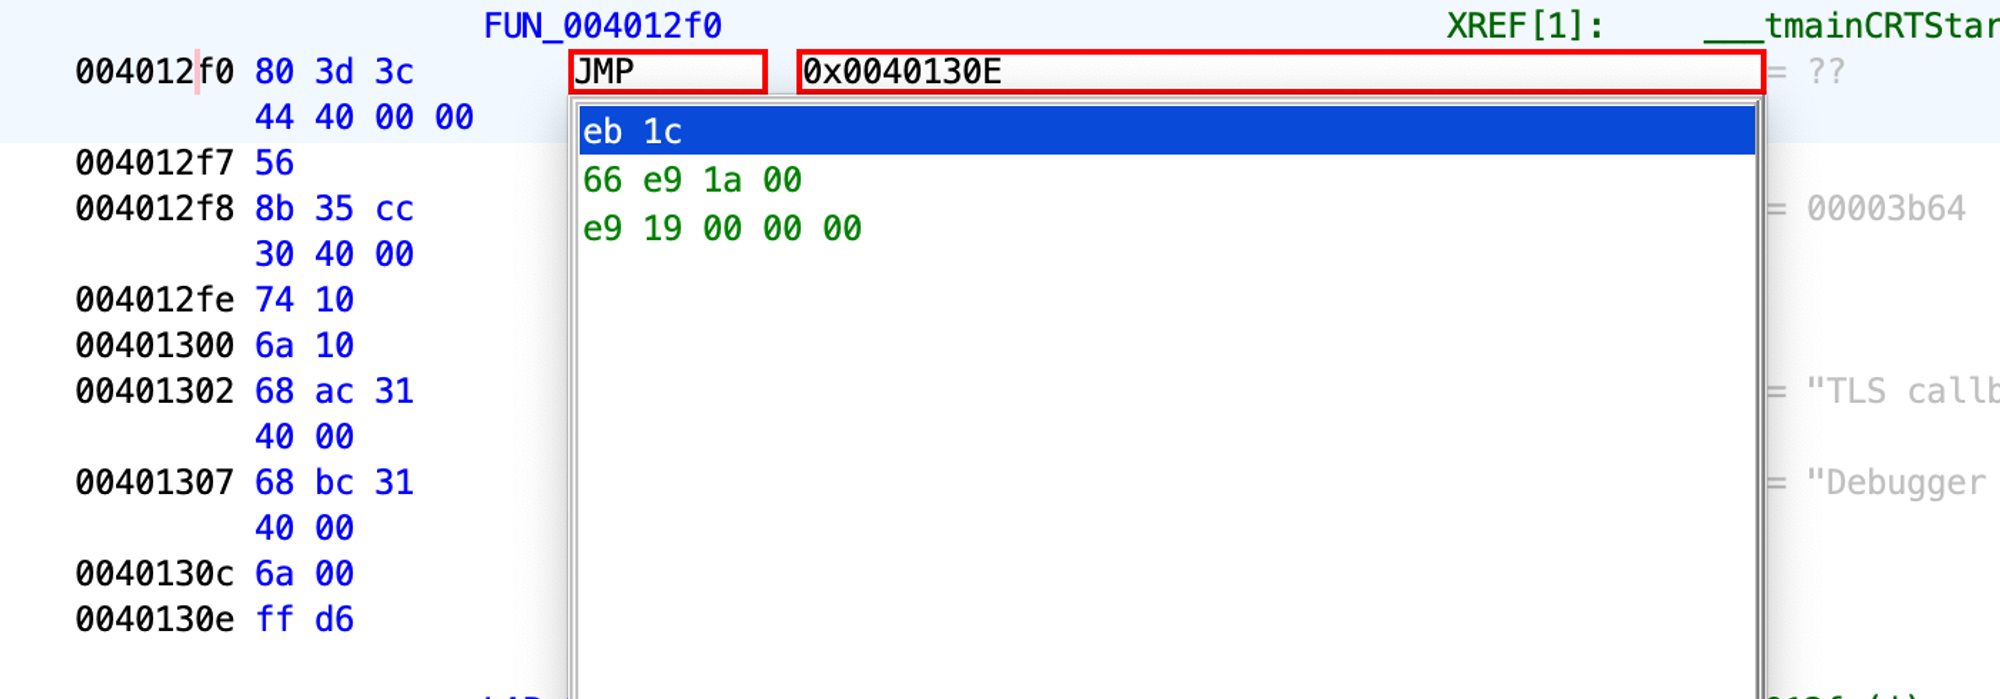
Now, we can replace this code with, say, jmp to jump to a specific address so that this condition is never satisfied. (In most cases, it can jump to the code we want to be executed next.)
Let’s jump to the address 0x40130E.

Right-click on this instruction address and select Patch Instruction.

After patching it, we see some leftover bytes because the instruction length has been decreased.
Patching a longer instruction with a shorter one is not a problem because we can create padding with NOP instructions. Let’s patch the leftover bytes:
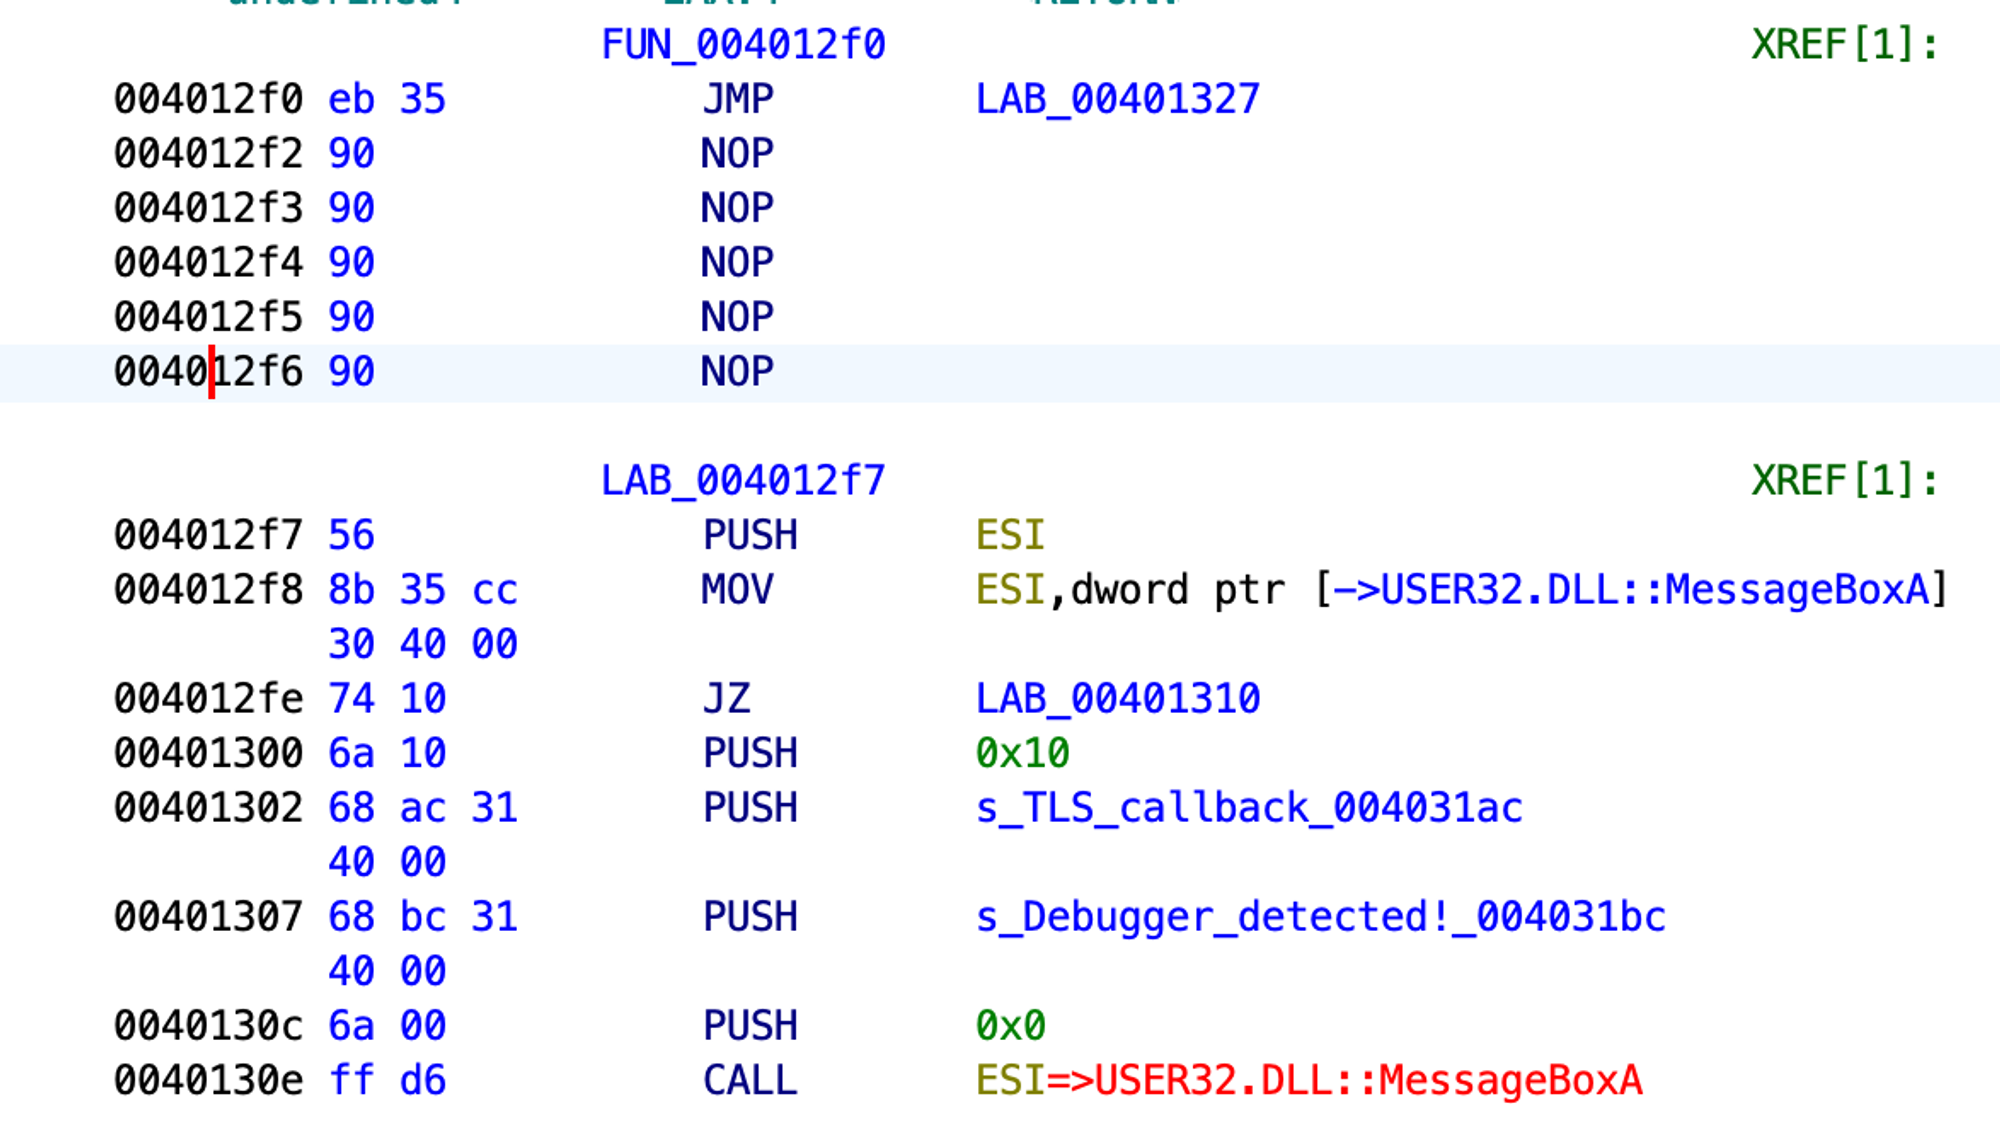
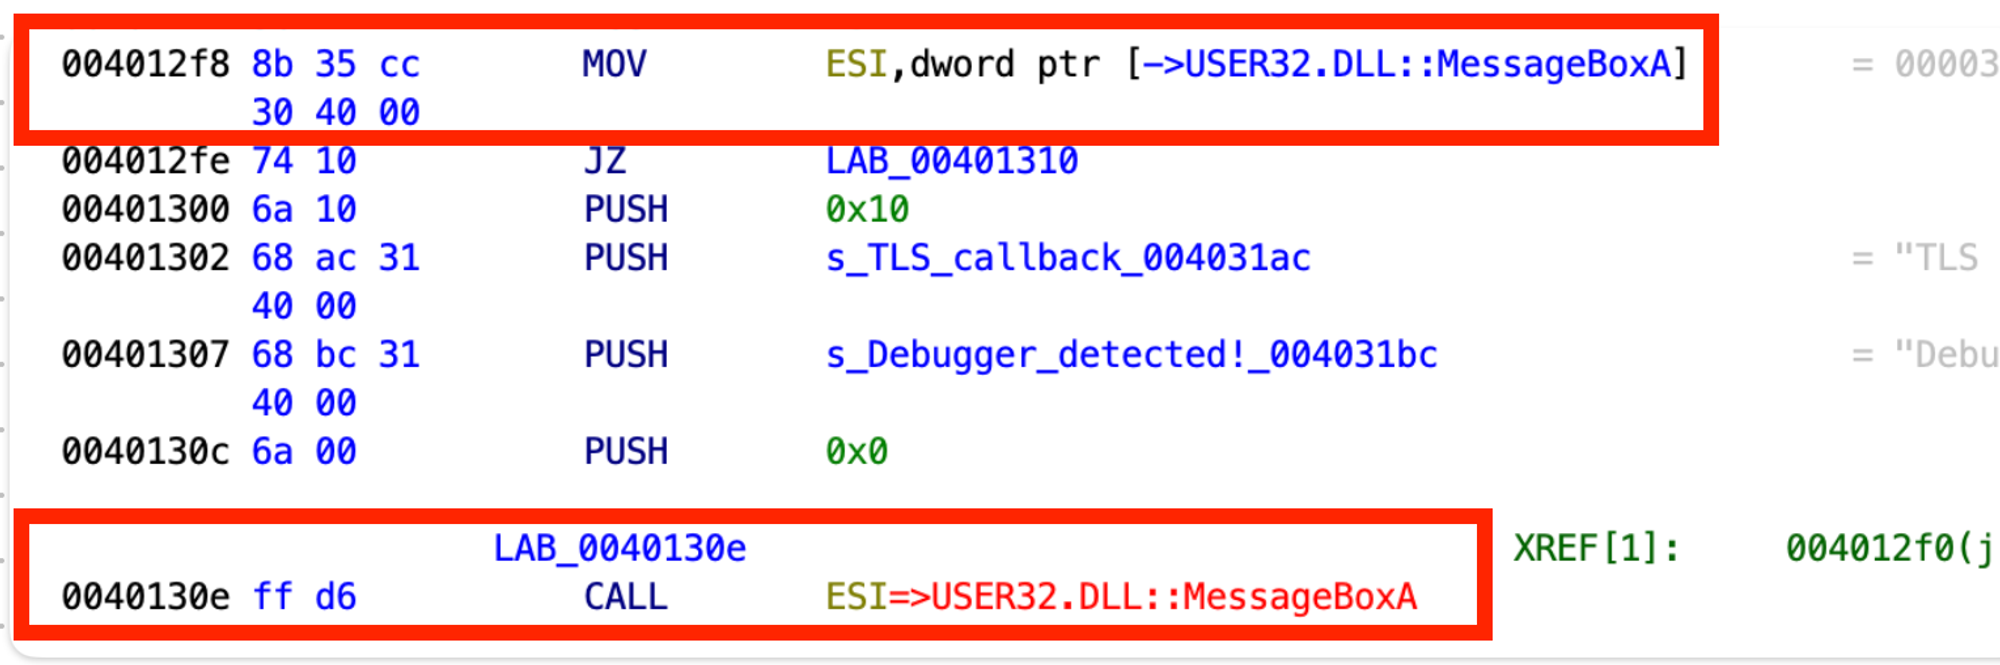
If we try to run our test application now, it crashes. When looking at the assembler code, we see that the new jmp will call ESI further down the code, and ESI will contain garbage instead of the MessageBox function address. Since we’re jumping over the address 0x004012F8, we’re skipping mov esi, dword ptr [→USER32.DLL::MessageBoxA]. Thus, ESI will not be initialized, and the application will crash at 0x0040130E.
Therefore, let’s be creative and jump to 0x004012F7 to move the MessageBoxA function address to ESI. This way, we also don’t skip the PUSH ESI command to avoid stack corruption (we have the POP ESI command at 0x0040132B). After that, let’s jmp to 0x00401317, the control flow branch where the application is considered to be registered, and replace 0x003D131E with NOPs.
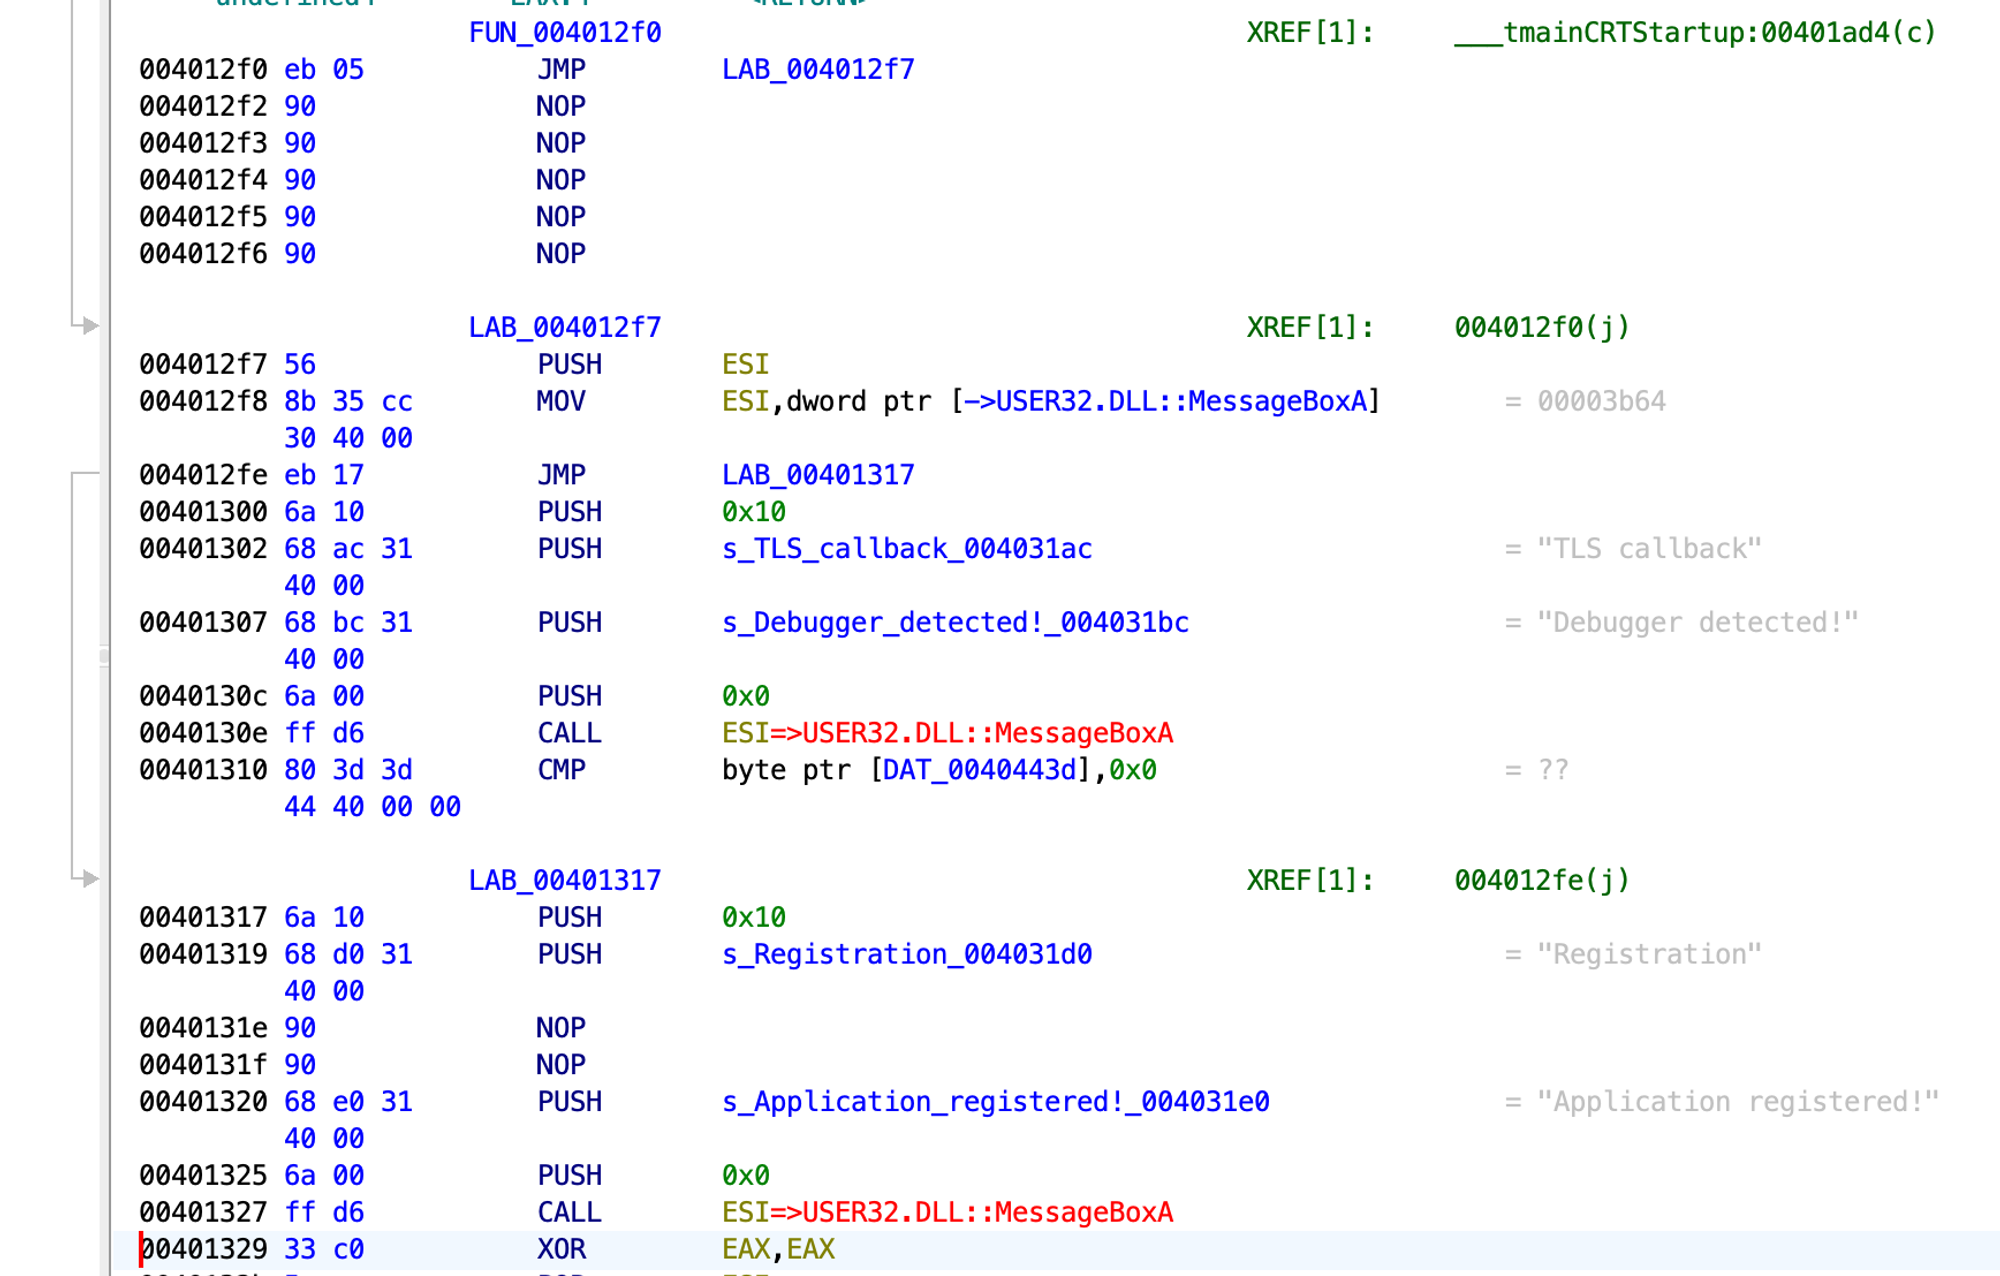
This is what we get:

The cmp command is double-byte, starting with 12F0, and the address starts with 12F2. We can see that jmp is a one-byte command and that its 05 address is relative, meaning it shouldn’t be in the relocation table.

To remove the 12F2 value from the relocation table, we need to open the current version of our test application with the Relocation Section Editor.
5. Delete a value from the relocation table with Relocation Section Editor
We start by loading the test application and finding the target value: 0x004012F2.
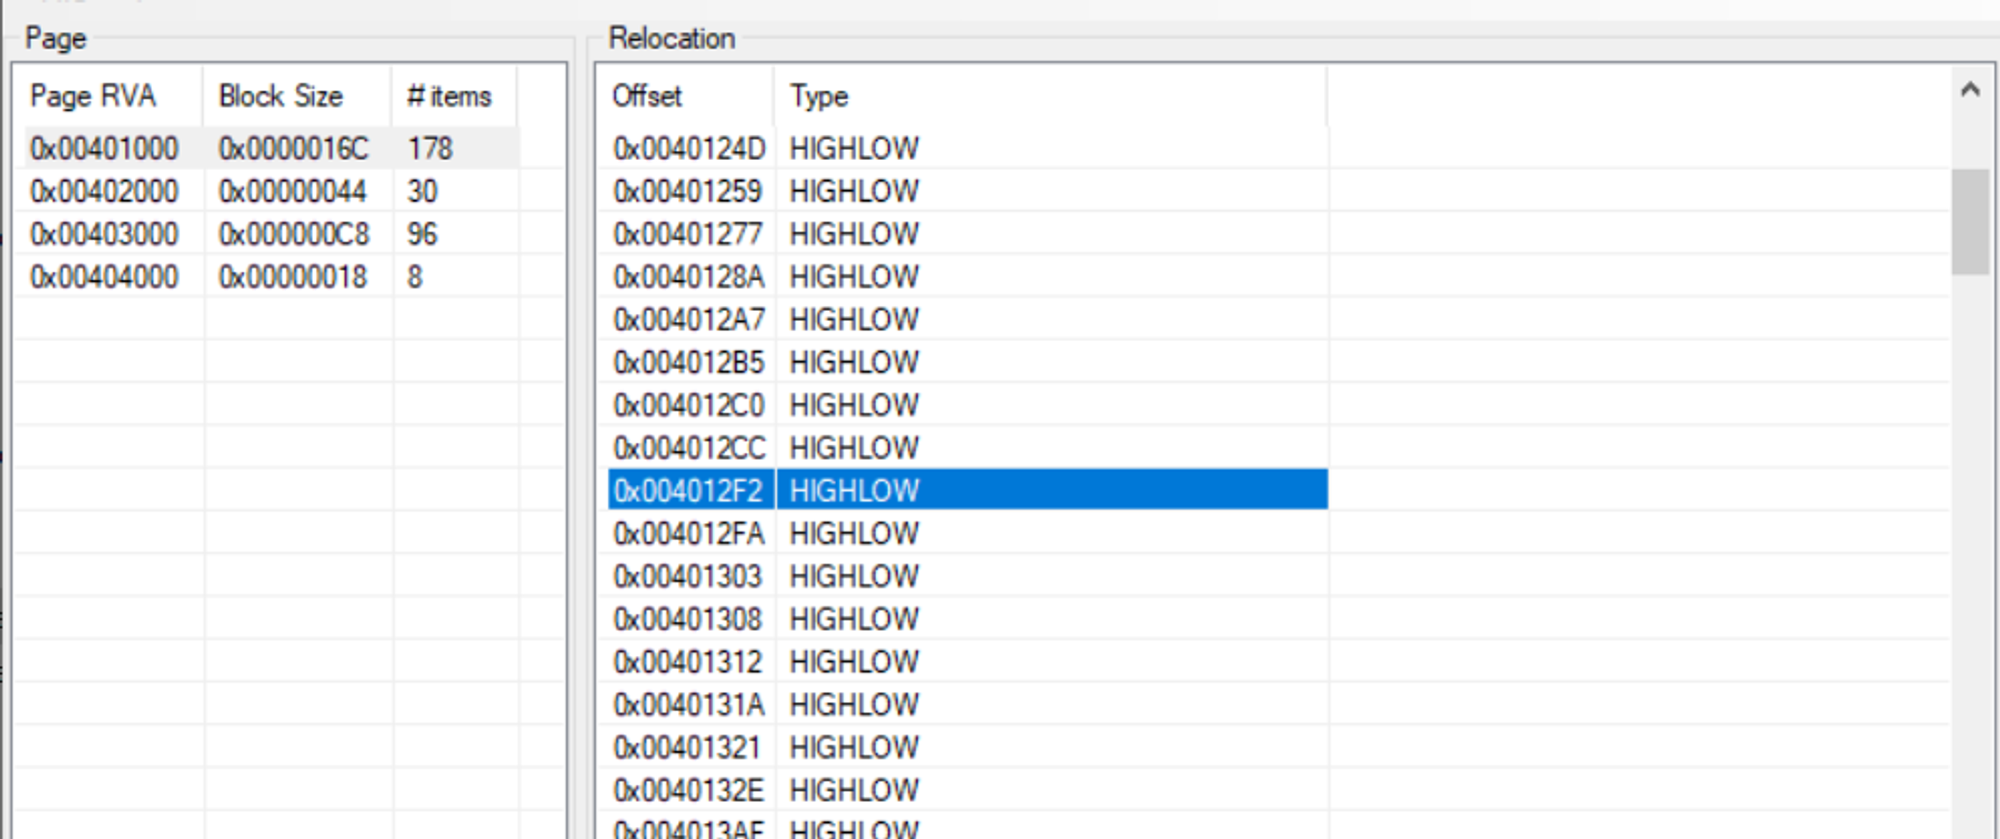
Next, we remove the target value and save the test application.
Related project
Developing and Supporting a CRM System for a Medical Transportation Company
Explore how Apriorit enhanced our client’s customer interactions and streamlined workflows through building a custom CRM solution and support system.
6. Modify values in the relocation table with CFF Explorer
Now, it’s time to open our test application in CFF Explorer. We have found the value — 1332 — on which delta for MessageBox used to be added.
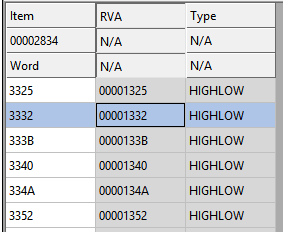
Let’s replace the value 1332 with the value 132B, the new offset by which MessageBox can be found. If we run the test application now, it won’t crash or show a warning message about a detected debugger.
Next, we move to working with the MessageBox function calls.
7. Monitor the application with API Monitor
This program can monitor a number of known API functions out of the box. You can also add your own functions to API Monitor and use this tool to monitor network function calls and research passed parameters (of course, if traffic is not encrypted).
Let’s monitor our application. We’ll try to find the call for the MessageBox function:
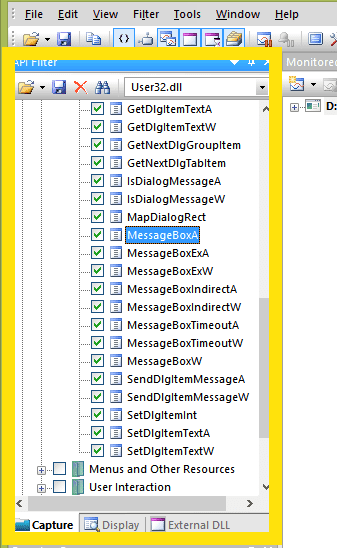
We’re interested only in the API functions that can show a message window. So we select only them in User32.dll.
In API Monitor, select File > Monitor New Process and set the path to our file. After running our process, we see the list of called functions. Let’s try to find MessageBox:
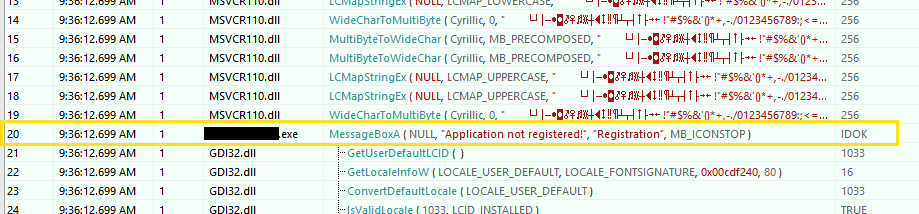
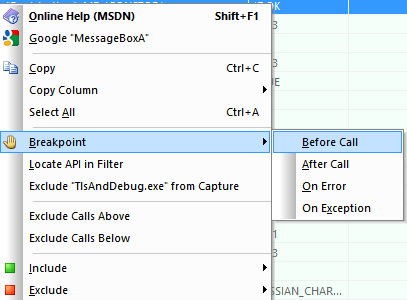
API Monitor shows which parameters were passed to the MessageBox function. We can also set different breakpoints for a function:
If we run monitoring of our file, we’ll get the following results:
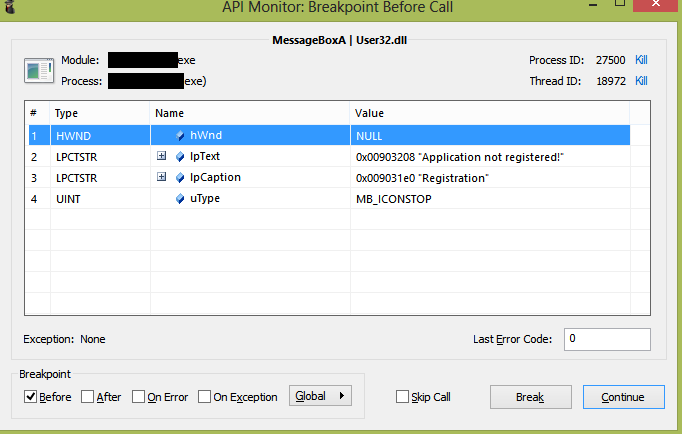
Screenshot 53 also shows the parameters passed to the MessageBox function.
Read also
Reverse Engineering in Cybersecurity: Apriorit’s Best Practices
Uncover vulnerabilities and enhance your software protection with reversing! Learn about reverse engineering best practices you can add to your cybersecurity strategy.

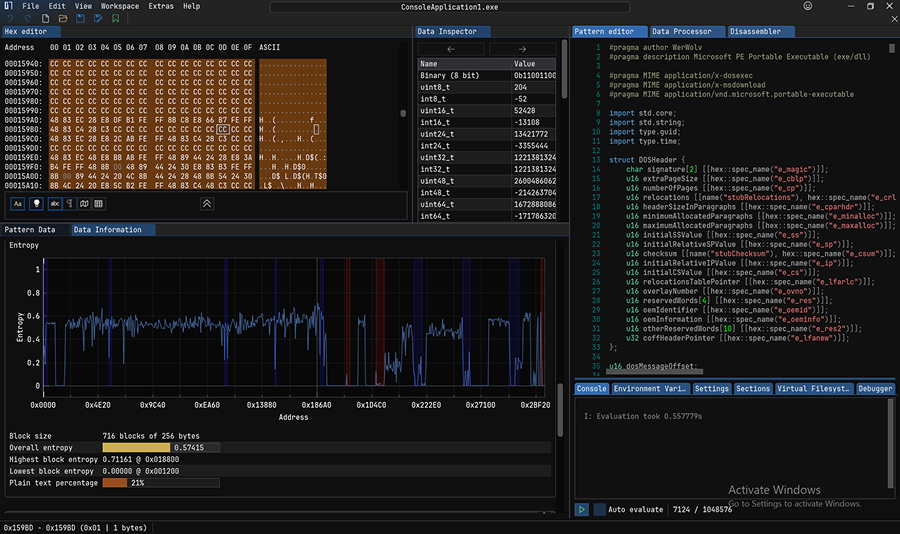
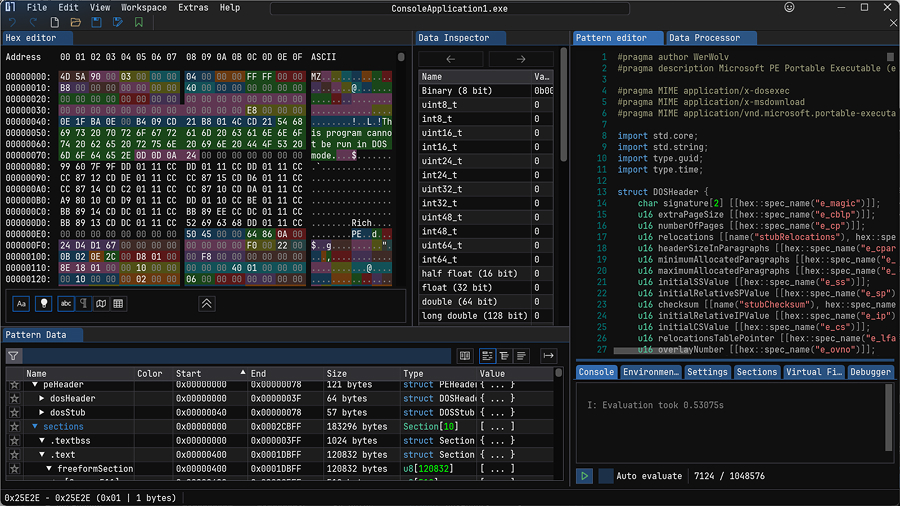
8. Determine a binary type with ImHex
Now, we move to working with binaries so we can find the code that we previously detected with IDA Pro and API Monitor. But before exploring a binary, we need to determine its type with a hex editor. In our example, we use ImHex.
Open the file with ImHex:
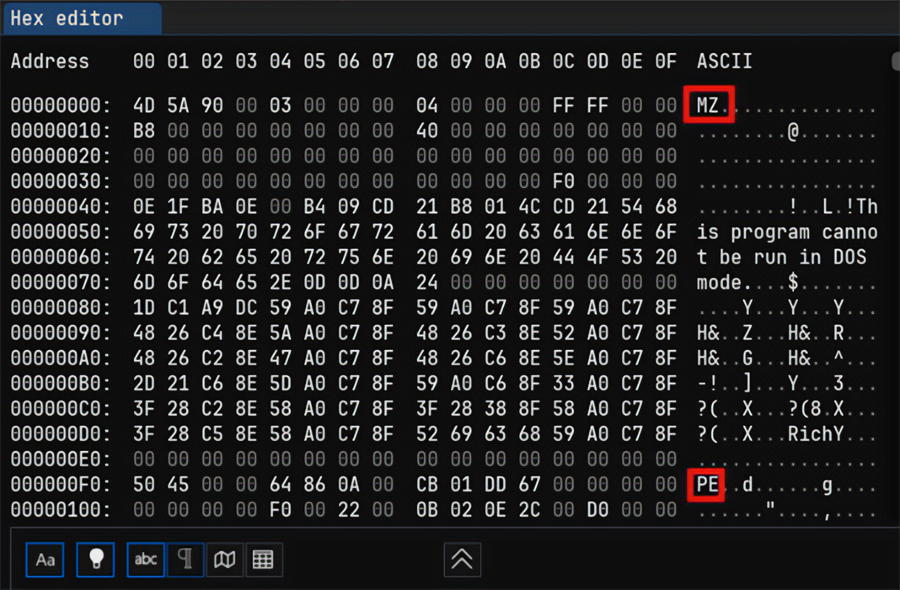
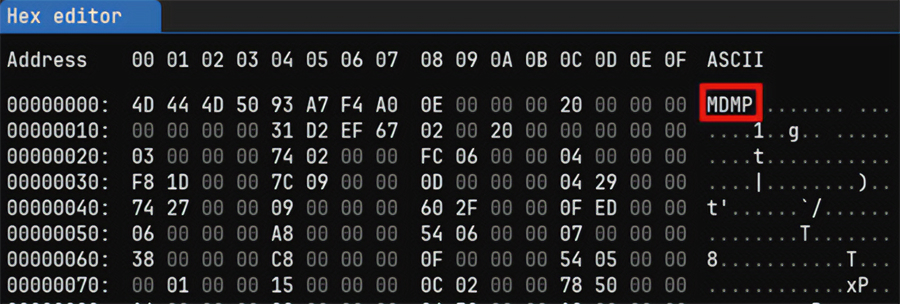
The MZ signature at the zero offset corresponds to PE format files (executables or shared libraries), so this is an .exe or .dll file.
Most file formats have unique signatures. For example, here’s what a dump file looks like in ImHex:
9. Recover the original executable with Scylla
To show you how to work with Scylla, we will once again use a packed application, but we won’t unpack it this time. Instead, we’ll dump its memory and try to run it.
To do that, we open the packed executable file in IDA Pro. This time, we need to find the original entry point (OEP) of the application rather than the entry point of the packer.
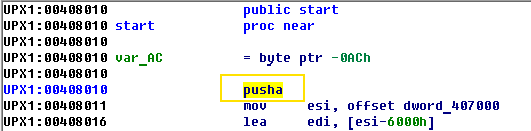
The pusha command saves general-purpose registers to the stack. In the end, there should be the popa command which pushes the stored register values. After the popa command, there is a jmp to the original point of entry. You can use the Search for text option by pressing Alt + T and look for the popa command.
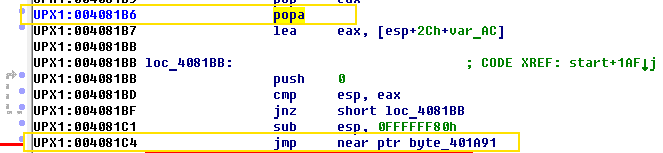
Below the popa command is jmp 40A191, which will eventually move to the original entry point.
Let’s put a breakpoint in jmp and run the debugger, then try to follow jmp. As a result, IDA Pro displays another warning message:
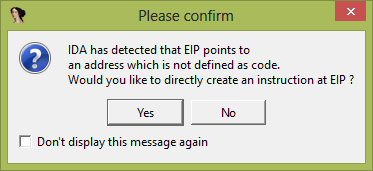
This message means that there is no code at the point we’re going to. Therefore, IDA will create instructions in disassembled listings on the basis of bytes pointed to by the Extended Instruction Pointer (EIP).
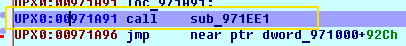
0x00971A91 is the address of the original entry point after unpacking the application into memory.
Read also
Web Application Penetration Testing: Minimum Checklist Based on the OWASP Testing Guide
Identify vulnerabilities before hackers do to safeguard your software from cyber threats with our comprehensive guide to penetration testing using the OWASP checklist.

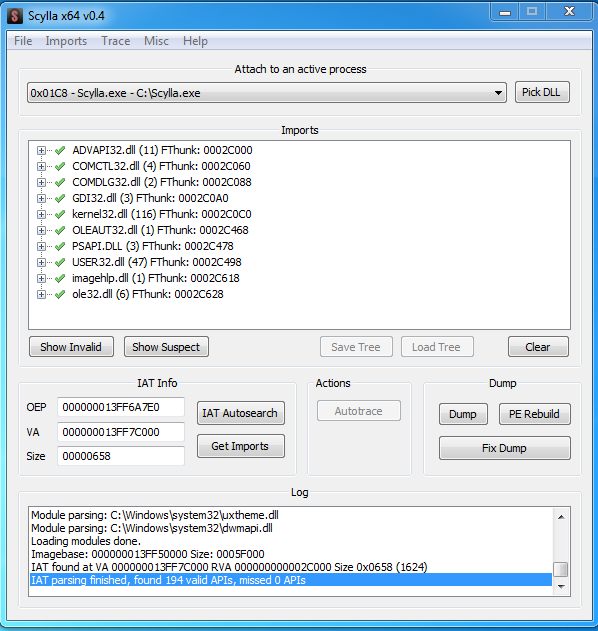
Now, without closing IDA Pro, open Scylla in order to create the application’s dump and restore the application’s import table from it.
In the process list, choose our application and put the OEP address into the field. Then choose IAT Autosearch > Get imports. As a result, Scylla will show that the import table has been found.
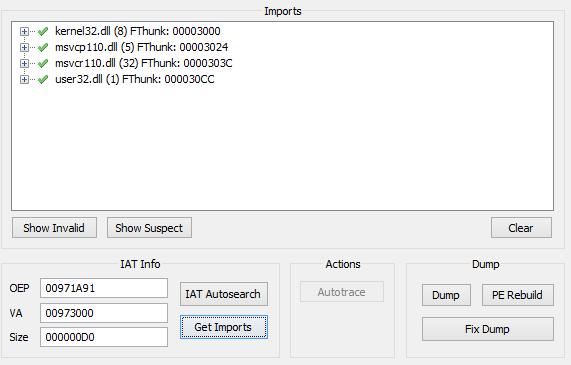
Let’s make an application dump: choose Dump, save the dump, then choose Fix Dump and select the previously saved application.
If we run our application now, it will crash, so we need to remove the relocation table. To do so, open the modified dump file (it has the _SCY prefix) in CFF Explorer.
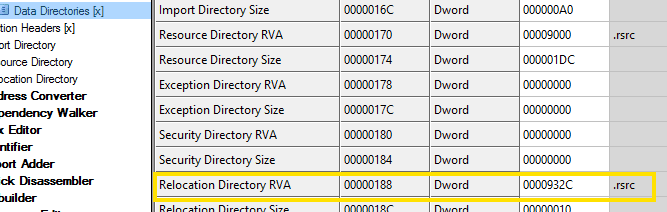
Set 0 in the Relocation Directory RVA field.
Next, we need to check whether the ImageBase is the same as the application loaded into memory.
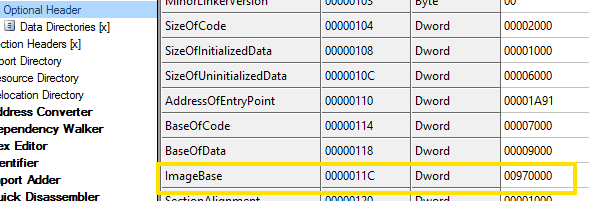
You can find the ImageBase value in IDA Pro by going to Edit > Segments > Rebase program.
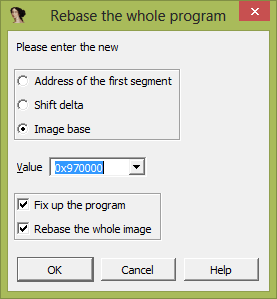
Let’s save and run the test application. Now, it will run as if it were packed, and we’ll be able to see how the program works without any protection or obfuscation.
In the next section, our experts show where AI can bring practical benefits and how it integrates with existing tools. We also provide a concrete example of integrating AI in reverse engineering.
AI-assisted software reverse engineering
Given the ease of integrating AI into existing reversing frameworks, AI-assisted reverse engineering is no longer a theoretical concept. Reverse engineering often involves repetitive work with decompiled code, which requires significant manual effort. Recent advances in large language models (LLMs) show that they can handle such tasks effectively, as decompiled code, like natural language, follows patterns and depends on context.
You can already use today’s general-purpose models to assist with many tasks — and they require relatively little setup. However, it’s worth noting that AI for reverse engineering should be treated as an assistant rather than an authoritative source. Each suggestion still requires human verification to avoid mistakes or misleading results.
Approaches to using AI for reverse engineering tasks
There are several practical ways to introduce AI into reverse engineering workflows:
- Ad-hoc use. The simplest approach is copying decompiler output into an AI assistant and asking for explanations or suggestions. This method works for quick checks but is inefficient for large projects.
- IDE or plugin integration. Some decompilers and editors support plugins that send code fragments directly to AI models and return annotations within the interface. This reduces context switching and is more scalable.
- Programmatic agent integration. Using frameworks such as the Model Context Protocol (MCP), AI agents can interact directly with the decompiler’s database. This allows agents to list functions or classes, run decompilation, rename items, and follow cross-references. Essentially, it automates sequences of operations that engineers usually perform manually.
These approaches vary in maturity, but even basic integrations can already reduce routine effort and accelerate early analysis.
Note: MCP-based AI integrations are still in early development. Simple queries like asking about a single function usually work well, while complex requests (for example, bulk renaming or large-scale decompilation) often fail or only partially succeed. Always be ready to rephrase prompts and verify results.
Both IDA and Ghidra now offer MCP-compatible servers, making them good candidates for experimenting with AI-assisted workflows. While MCP is not yet fully mature, it provides a promising foundation for building more robust automation in reverse engineering.
Practical example of AI-assisted reverse engineering using Ghidra with MCP
Our engineers use MCP, as it enables structured interactions between AI agents and reverse engineering tools. To illustrate the scope of MCP’s capabilities, we set up the following environment:
After connecting the tools and providing an API key, we loaded a test application [.exe] (an unpacked sample that we used earlier in another example) and began experimenting with AI-assisted analysis.
Step 1. Renaming functions
The binary contained a number of unnamed functions with automatically generated labels in the form of FUN_*. As you can see in screenshot 64 below, these generic names make navigation unmanageable.
![Examples of unnamed functions in a test application [.exe]](https://www.apriorit.com/wp-content/uploads/2021/06/Examples-of-unnamed-functions-in-a-test-application-.exe_.png)
With the help of an AI agent, we requested more descriptive function names. Here is what the prompt and the output look like.
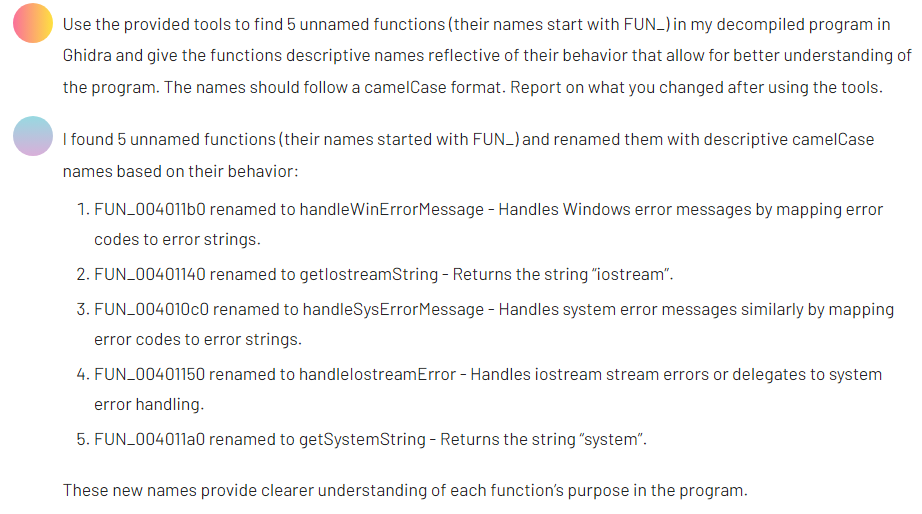
The output provided clearer identifiers that improved the readability of the codebase.
Step 2. Preparing a TLS callback for analysis
Next, we examined a TLS callback function suspected of checking for the presence of a debugger. Before analyzing its logic, we asked the AI agent to rename the function’s variables for clarity.
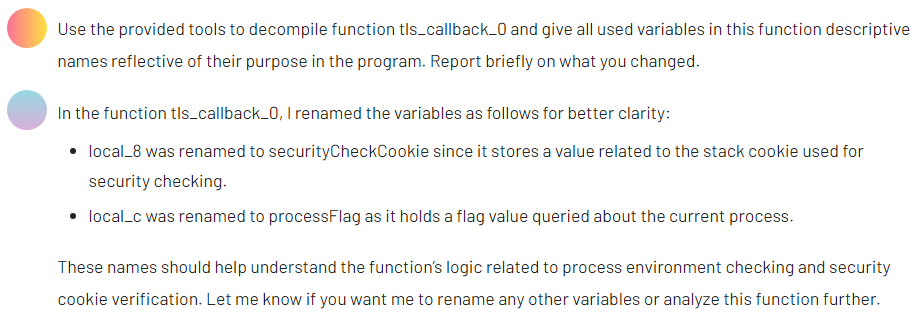
After making these changes, we then requested a plain-language summary of the function’s purpose.
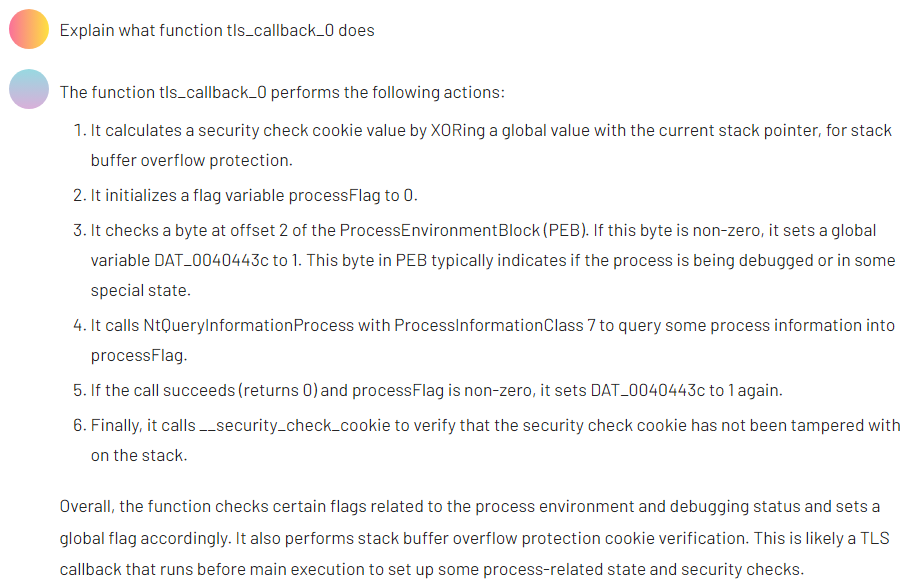
The result aligned with our earlier manual conclusions, confirming that the callback includes anti-debugging behavior.
Step 3. Analyzing a more complex algorithm
Since the first sample of a test application [.exe] offered a limited variety, we turned to a second test case: a note-taking application. In this program, we identified a moderately complex function that manipulated arrays. For readability, we transferred the C-like decompiled output into Visual Studio Code.
After prompting the AI, we received a structured explanation of the function’s behavior, which helped clarify its role in the broader logic of the application.
Step 4. Renaming variables and parameters
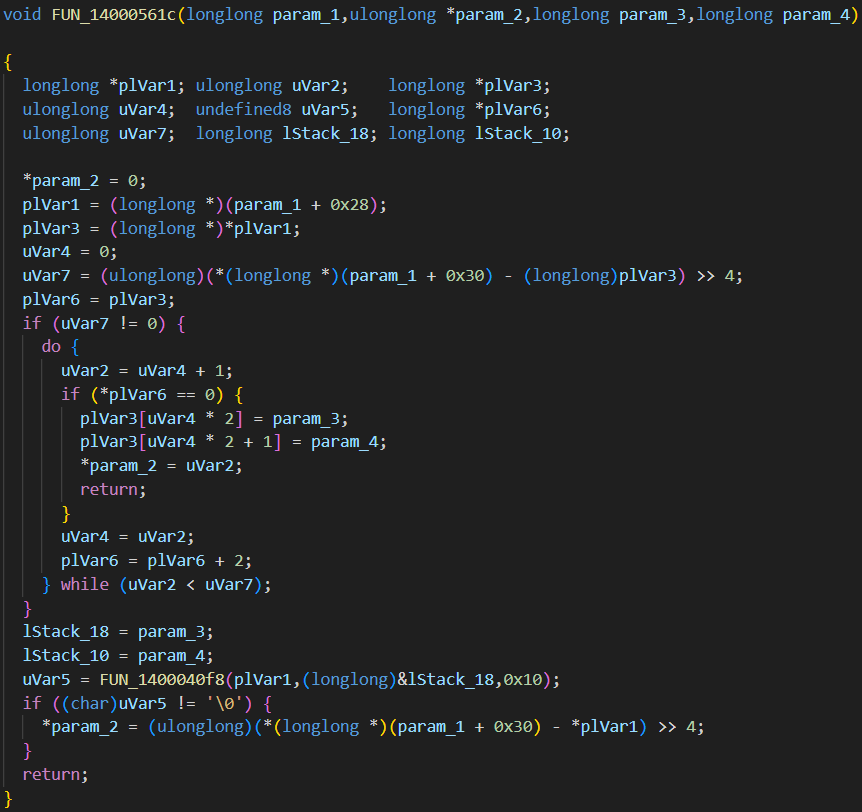
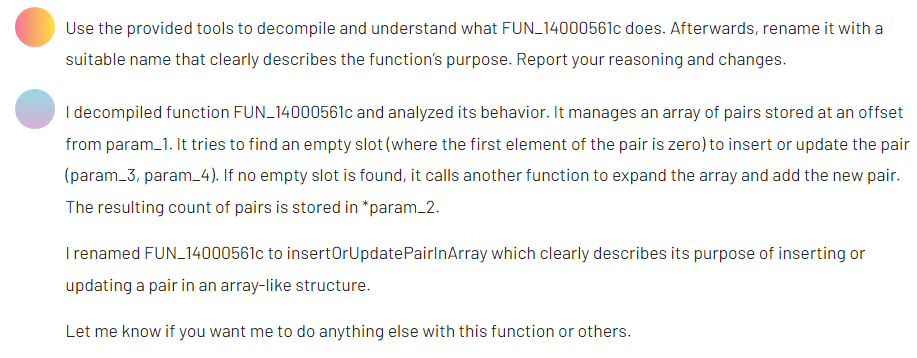
Finally, we asked the AI agent to rename all remaining parameters and variables in the insertOrUpdatePairInArray function. If this function call leads to calling other functions, the agent should rename them as well. We trimmed the verbose AI output for review:
Although we could still see some inconsistencies, the changes improved overall code readability.
This short experiment shows how AI can reduce time spent on repetitive renaming and documentation tasks while also providing quick insights into specific functions. However, the results still need careful manual review. For now, using AI for reverse engineering should be treated as a supportive tool rather than a replacement for manual analysis.
How Apriorit can help you with reverse engineering
Apriorit’s reverse engineering team has been helping businesses dissect software to optimize it, find vulnerabilities, or plan its modernization for over 20 years.
We specialize in non-trivial challenges and can deconstruct even the most complex systems. Our team has successfully reversed various types of projects, from cybersecurity solutions and legacy applications to proprietary protocols and obfuscated software.
We strictly adhere to legal and ethical standards, conducting only lawful reverse engineering for purposes such as security analysis, system integration, and performance optimization. Before taking on a project, we carefully evaluate its legal aspects.
When you work with us, you get:
- Clear insights into your software – Get a detailed breakdown to fill in the gaps in your documentation and allow your team to work with your software further depending on your specific goal.
- A detailed report on your software’s current state – At the end of the project, you’ll get a detailed report outlining our research, methodologies, and findings. This helps you address security risks, recover lost functionality, and make informed decisions about further development.
- A roadmap to solving your challenges – Along with the report, you’ll also get a list of recommendations on how to mitigate blockers that prevent you from migrating, securing, or integrating your software. Our team can also follow these recommendations to help you get a ready solution for your needs.
Apriorit is a trusted partner with the expertise to handle complex reverse engineering tasks using the best reverse engineering software.
Conclusion
Reverse engineering can help you solve various technical challenges, from security audits and vulnerability assessments to software modernization, undocumented feature analysis, and source code recovery.
To perform these tasks successfully, you need the right set of tools and professionals with deep expertise. Understanding when and how to use static and dynamic analysis, network traffic inspection, and executable analysis is crucial for achieving accurate results.
Outsourcing reverse engineering to an experienced company like Apriorit can save you time and resources on building internal reversing expertise. Whether you need to ensure compliance, extend the functionality of legacy applications, or integrate with third-party solutions, we can provide you with a clear plan to achieve your business and technical goals.
Looking for an expert team of reverse engineers?
Our team with over 20 years of experience is ready to tackle any challenge, from analyzing proprietary files and closed protocols to reversing your firmware and software.
FAQ
What are reverse engineering tools?
<p>Reverse engineering tools are software applications used to analyze compiled programs and understand how they work without access to the original source code. They help developers, security researchers, and engineers inspect binaries, trace program behavior, debug applications, and reconstruct program logic.</p>
<p>Depending on the task, reverse engineering tools support different types of analysis, such as static analysis, dynamic debugging, binary inspection, and network traffic monitoring.</p>
<p>Reverse engineering tools that we commonly use include:</p>
<ul>
<li>IDA Pro</li>
<li>Ghidra</li>
<li>Radare2</li>
<li>ImHex</li>
<li>x64dbg</li>
<li>Frida </li>
<li>Wireshark </li>
<li>Fiddler</li>
</ul>
What are the most popular reverse engineering tools?
<p>Two of the most widely used tools for reverse engineering are IDA Pro and Ghidra. IDA Pro is a commercial tool with a wide variety of plugins for specific tasks, and Ghidra is a US government-developed alternative that’s free and highly extensible.</p>
<p>Other popular tools include Frida, Wireshark, and Fiddler, each serving different needs — from static analysis and debugging to automation and network analysis.</p>
How can I select the right reversing tool?
<p>To choose an appropriate toolkit, your reverse engineering team needs to evaluate the task and target environment. For example, if you need to analyze malware or proprietary binaries, consider using an advanced disassembler and debugger like IDA Pro or Ghidra. </p>
<p>If the goal is platform-specific research, your team should have experience with specialized tools for Windows, Linux, or macOS. </p>
<p>When choosing a toolset for a reverse engineering project, our specialists at Apriorit evaluate architectural compatibility, automation capabilities, collaboration functionality, and whether it can perform the tasks at hand.</p>
What challenges do enterprises face when reverse engineering complex software?
<p>Enterprises often struggle with obfuscation and anti-reverse engineering protections that make analysis slow and labor-intensive. Complex systems typically include undocumented behavior and tightly coupled dependencies that require deep platform knowledge to interpret. </p>
<p>Your reverse engineering team should know how to navigate these constraints, validate what can be legally analyzed, and apply the right techniques to extract meaningful insights without exposing the organization to risk.</p>
<p>These factors require organizations to invest in specialized expertise, advanced tooling, and clear internal processes to avoid costly delays or compliance violations.</p>
Why should companies outsource reverse engineering instead of doing it in-house?
<p>Outsourcing gives companies immediate access to specialists who work with diverse architectures, tools, and protection techniques daily. This accelerates analysis, reduces risk, and eliminates the cost of building and maintaining an internal reverse engineering team, which is often more expensive and time-consuming than hiring a third-party vendor.</p>
<p>An established vendor also brings rigorous legal and compliance practices, ensuring that the whole analysis is done safely and ethically. </p>
<p>By outsourcing reverse engineering, you let your internal teams stay focused on product development and core business priorities rather than complex low-level research.</p>
Which reverse engineering tools are best for enterprise-level projects, and why?
<p>For enterprise-scale projects, IDA Pro, Ghidra, and Radare2 are the most effective. IDA Pro provides unmatched disassembly quality, mature debugging features, and a rich plugin ecosystem. </p>
<p>Ghidra offers collaborative project support, extensibility, and no licensing costs, making it ideal for large teams. Radare2 excels in automation and scripting, enabling efficient processing of high-volume or repetitive reverse engineering tasks. </p>
<p>Together, these tools cover the full spectrum of enterprise binary analysis needs.</p>
How does reverse engineering improve software security and compliance?
<p>Reverse engineering helps organizations uncover vulnerabilities, hidden functionality, or malicious components that traditional testing might miss. With its help, your team can evaluate third-party code for security risks, licensing issues, or non-compliant behavior. </p>
<p>Understanding how your software actually behaves gives you an opportunity to harden your systems, prevent breaches, and avoid regulatory or contractual violations.</p>
How does a DLL decompiler work?
<p>DLL decompilation depends on the technology used to build the file. .NET DLLs contain intermediate language (IL) code, making them relatively easy to decompile into readable C# using tools like dnSpy or ILSpy. </p>
<p>Native DLLs compiled from C/C++ produce machine code, which cannot be cleanly reconstructed into high-level source code. Analyzing them requires disassemblers and debuggers that translate binary instructions into assembly and help infer logic manually — a far more complex and time-consuming process.</p>
What’s the most efficient way to handle non-trivial reverse engineering tasks?
<p>The most effective approach we take at Apriorit combines expert-level analysis, automation, and the right toolkit. Our reverse engineers bring together static and dynamic techniques, cross-referencing disassembly, behavior traces, and memory analysis to build an accurate picture of the system. </p>
<p>At the same time, tools like IDA Pro, Ghidra, and Radare2 help our engineers automate repetitive work while they interpret complex structures, obfuscation, or undocumented behavior. This hybrid workflow ensures efficiency without sacrificing precision, especially in large-scale or high-risk projects.</p>
Have a question?
Ask our expert!
Program Manager


