 Skip to main content
Ever faced a situation where your product suddenly gains traction, attracts thousands of new users, and then starts to break under pressure? It’s a common challenge for teams building modern digital services. Spikes in traffic, whether from organic growth or a successful launch, can quickly expose hidden performance bottlenecks and system weaknesses. That’s why it’s not enough to have clean code and a solid architecture. For Golang-based microservices, peak system resilience requires a proactive approach to performance validation.
In this article, we walk you through how to design and run targeted load tests for Golang microservices, set up a custom metrics collection strategy, and analyze performance results to identify areas for improvement.
This guide will be useful for technical decision-makers, CTOs, and product owners who want to proactively address performance risks and scale their Golang applications with confidence.
Contents:
What is load testing, and why does it matter?
Load testing is a fundamental aspect of performance and stability testing that assesses how an application behaves under expected and peak user loads. In the context of Golang-based microservices, load testing helps confirm compliance with performance requirements, predict future resource needs, and prevent performance-related issues before they impact production.
Load testing is an effective practice that can bring:
- Improved stability. Detecting and resolving bottlenecks before they reach production helps maintain a reliable user experience, even during peak traffic events. Load testing also can prevent costly outages and protect brand reputation.
- Optimized resource use. Performance testing for microservices shows inefficiencies in service configuration, which allows your teams to fine-tune resource allocations and reduce cloud infrastructure costs.
- Scalable architecture validation. As the system grows, consistent load testing guarantees that infrastructure and services can keep up without performance degradation.
Even though a microservices architecture offers flexibility, it comes with certain complexities. Let’s see how you can load test microservices in this environment.
Struggling with unpredictable performance under load?
Our team can help you design efficient load testing strategies, uncover bottlenecks, and optimize your system for peak performance.
How to design effective load tests for microservices
Microservices, unlike monolithic applications, are composed of distributed, loosely coupled services that interact over networks. This type of architecture requires load testing strategies tailored to its dynamic nature.
As a result, creating effective load test microservices scenarios should be about precision and realism. Your teams need to simulate actual user behavior and know exactly what they are trying to learn instead of throwing traffic at the system. The main attributes of a good load testing scenario include:
- Realistic user flows. Recreate actual usage patterns by combining different user actions and request types. Try to avoid synthetic loads that don’t reflect real-world conditions.
- Clear and measurable goals. It’s best to define a test’s objective: for example, to measure response times, confirm stability under peak loads, or stress a specific database.
Here are some typical goals that you can use for effective microservices load testing:
- Database performance — isolate and test database response times and other key metrics
- Bottleneck detection — identify slow or overloaded system components
- Scalability checks — determine if the system can efficiently handle increasing traffic
- System stability — verify that the application remains functional under a defined load
Let’s see how this works in a real-world scenario. Say you want to test database performance. A poorly designed test might send all requests through the system’s entry point, overwhelming the API gateway or authentication service and creating an artificial bottleneck. While that service might crash under pressure, other components might go unnoticed, potentially leading to issues down the line. A focused test would simulate requests only to the services communicating with the database, simplifying test setup while still delivering actionable insights.
Load testing metrics
Knowing what metrics to collect is important as well, especially in a microservices architecture where each component can scale and fail independently. Common metrics include:
- Response time — The time it takes for the system to respond to a request, typically measured in milliseconds and displayed with min, max, and average values
- CPU utilization — The percentage of CPU resources being used during the test
- Memory usage — The amount of RAM consumed by the system during the test
- Database response time — The time it takes for the database to process a request; usually displayed with min, max, and average values
- Error rate — The percentage of requests that fail or return unexpected results
These metrics allow your team to find bottlenecks faster and monitor the efficiency and stability of specific services. Over time, they can also provide a baseline for what normal performance looks like so that you can detect regressions early on.
In the next section, we’ll guide you through every step of load testing microservices, with practical examples from our project.
Microservice load testing: Step-by-step example
To show you our load testing strategy for Golang-based microservices, we will implement a controlled testing environment with realistic CPU and memory pressure under two load scenarios. Here’s how we’ll do it:
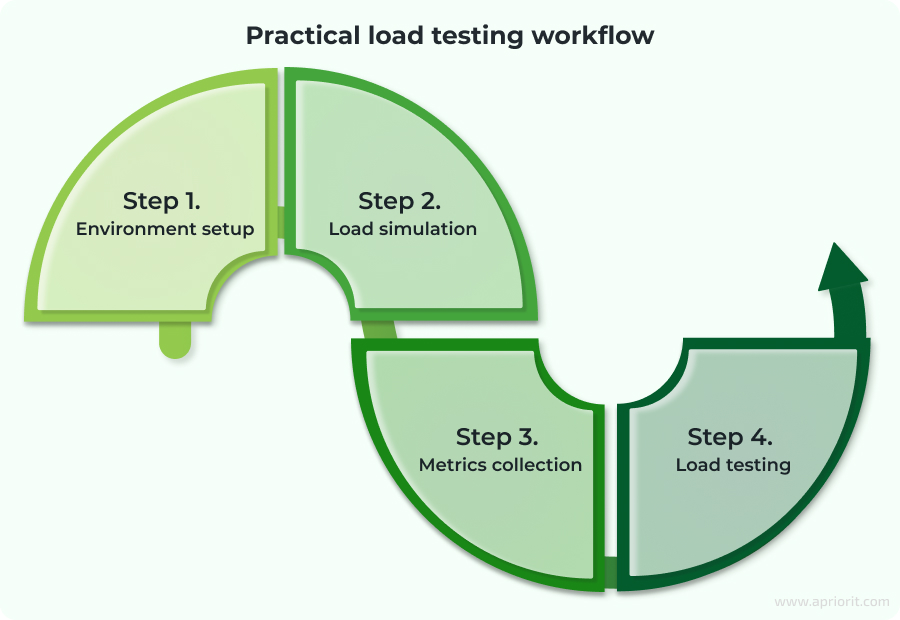
Step 1. Environment setup
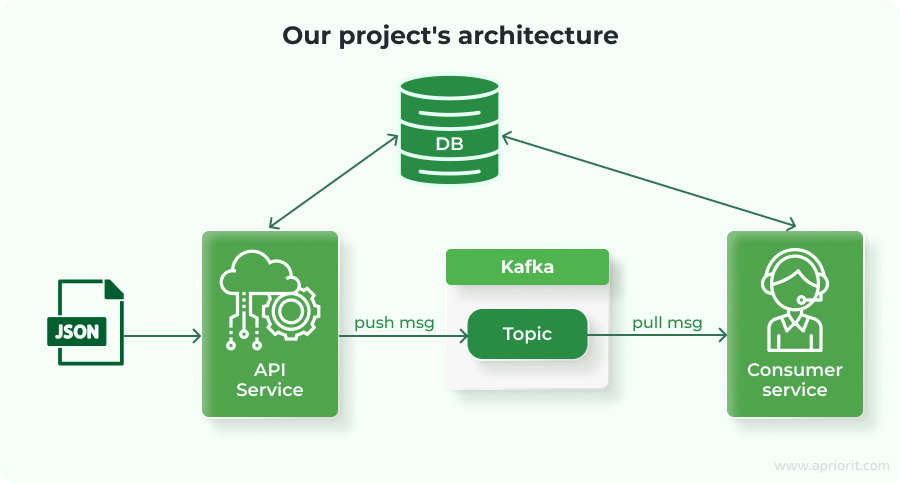
First, we will deploy a simple microservices architecture to a Kubernetes cluster. It includes a PostgreSQL database, a Kafka message broker, and two services:
- API service that receives incoming messages, stores them in PostgreSQL, and publishes them to Kafka
- Consumer service that subscribes to Kafka, processes incoming messages, and writes the results back to PostgreSQL
Here is what our architecture looks like:
Step 2. Load simulation
To create realistic CPU and memory stress, we will embed synthetic computation into both services. The load simulation mimics CPU-bound operations by generating and multiplying square matrices. This workload scales linearly with matrix size and creates a flexible way to adjust system pressure.
#function to generate a random square matrix of a given size
func generateMatrix(matrixSize, maxint int) [][]int {
	matrix := make([][]int, matrixSize)
	for i := range matrix {
    	matrix[i] = make([]int, matrixSize)
    	for j := range matrix[i] {
        	matrix[i][j] = rand.Intn(maxint)
    	}
	}
	return matrix
}

#function to multiply matrices
func multiplyMatrices(a, b [][]int) ([][]int, error) {
	rowsA, colsA := len(a), len(a[0])
	rowsB, colsB := len(b), len(b[0])

	result := make([][]int, rowsA)
	for i := range result {
    	result[i] = make([]int, colsB)
    	for j := range result[i] {
        	for k := 0; k < colsA; k++ {
            	result[i][j] += a[i][k] * b[k][j]
        	}
    	}
	}
	return result, nil
} To increase CPU load, the result of the multiplyMatrices function is passed to the ModSumMatrix function and then saved to the database.
func ModSumMatrix(matrix [][]int) int {
	total := 0
	for _, row := range matrix {
    	for _, val := range row {
        	total = (total + val) % 17
    	}
	}
	return total
} With this workflow, we make sure that both CPU and memory are taxed under realistic conditions.
Step 3. Metrics collection
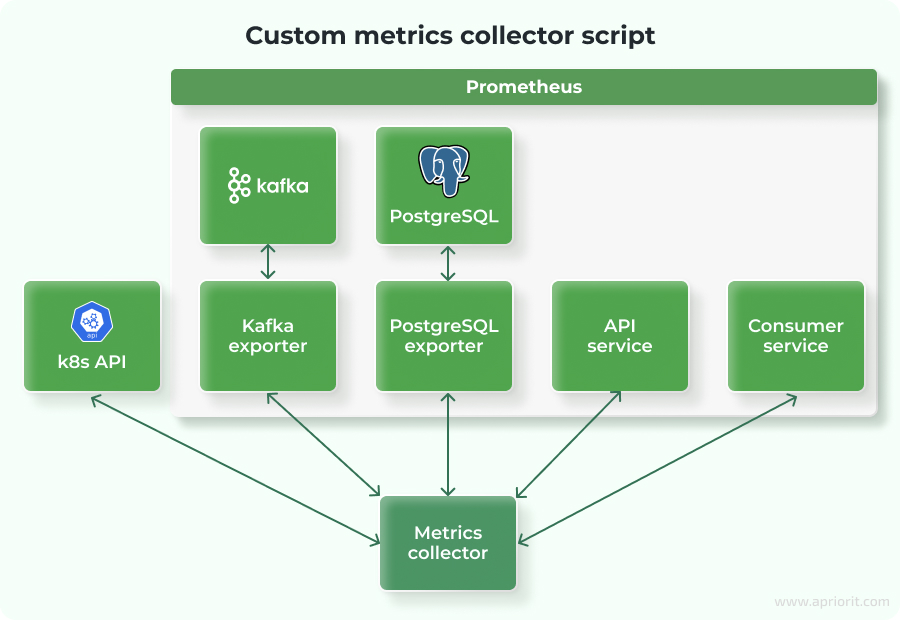
To analyze and interpret the results of load testing, we need to collect metrics from all components involved in the microservices architecture. In our setup, this includes the following:
- API and Consumer services
- PostgreSQL database
- Kafka message broker
- The Kubernetes cluster itself
Collecting these metrics will grant us visibility into how the system behaves under load and will help us easily identify bottlenecks.
Collecting metrics from Golang services
Both the API and Consumer services expose a /metrics endpoint using the Prometheus Go client. This allows Prometheus or any custom collector to scrape runtime statistics directly from each service:
r := gin.Default()
#New metrics endpoint
r.GET("/metrics", gin.WrapH(promhttp.Handler()))Here are the metrics we will collect from the Golang runtime:
go_goroutines— Number of active goroutines, showing concurrency loadgo_sched_gomaxprocs_threads— Reflects GOMAXPROCS, the number of OS threads used for schedulinggo_threads— Number of OS threads created by the Go schedulergo_gc_duration_seconds_count— Number of completed garbage collection cyclesprocess_cpu_seconds_total— Total CPU time consumed by the application
These metrics help us assess application efficiency, concurrency load, garbage collection overhead, and CPU consumption during test execution.
Collecting Kafka metrics
To gather metrics from Kafka, we will use the kafka-exporter container. This exporter scrapes Kafka internals and converts them into a Prometheus-compatible format:
minikube kubectl -- run kafka-exporter \
  --image=danielqsj/kafka-exporter \
  --image-pull-policy=Always \
  --restart=Always \
  --port=9308 \
  --env="KAFKA_SERVERS=<your_kafka_svc_ip>:9092" \
  --command -- /bin/sh -c \
"kafka_exporter --kafka.server=<your_kafka_svc_ip>:9092"Here are the metrics that we will collect:
topic_lag— Indicates how far behind the consumer is from the topictopic_offset— Tracks the latest committed offset for a consumer group of the topic
These metrics are very important for understanding real-time throughput and message processing delays in event-driven systems.
Collecting PostgreSQL metrics
We will monitor database performance with the help of postgres-exporter. The exporter is configured to convert PostgreSQL internals and connection states:
minikube kubectl -- run postgres-exporter \
  --image=quay.io/prometheuscommunity/postgres-exporter \
  --image-pull-policy=Always \
  --restart=Always \
  --port=9187 \
  --env="DATA_SOURCE_URI=<your_postgres_ip_address>:5432/postgres?sslmode=disable" \
  --env="DATA_SOURCE_USER=admin" \
  --env="DATA_SOURCE_PASS=secret" \
  --command -- /bin/sh -c \
"postgres_exporter --web.listen-address=:9187"Here are the PostgreSQL metrics that we collect here:
user_active— Number of active connections to the databaseuser_idle— Number of idle connections
Monitoring these values helps us identify under- or over-used connections and overall database load.
Collecting Kubernetes cluster metrics
To observe CPU and memory usage of the pods, we will use the Kubernetes Metrics API. First, we will enable the metrics-server add-on:
minikube addons enable metrics-serverAfter that, we will create a service account to access metrics data externally:
#Creating a service account
minikube kubectl -- create service account admin-user
#Generating a token for the service account
minikube kubectl -- create token admin-userThis allows us to track memory and CPU use for each microservice during the tests. This is crucial for correlating Golang runtime data with actual container resource consumption.
Summarizing all metrics
To simplify data collection and analysis, we will create a custom metrics collector script in Go. This tool pulls data from the following endpoints:
Table 1. Custom metrics collector
| Metric source | Endpoint |
|---|---|
| API service | http://localhost:8080/metrics |
| Consumer service | http://localhost:3000/metrics |
| Kafka exporter | http://localhost:9308/metrics |
| PostgreSQL exporter | http://localhost:9187/metrics |
| Kubernetes metrics API | https://localhost:3005/apis/metrics.k8s.io/v1beta1/pods |
The script collects raw metrics during the load test run and calculates min, max, and average values for each tracked metric. These statistics are then used to generate final performance reports for analysis.
Now, let’s perform real load tests.
Step 4. Load testing
To assess system behavior under varying conditions, we will perform two load tests using different input sizes and the same load rate. Each test simulates a matrix multiplication operation, which stresses CPU, memory, and I/O components. This way, we create a controlled environment to measure service performance.
Test 1. Baseline performance (Matrix size: 250)
The initial test serves as a baseline for evaluating microservice behavior. The input size is relatively moderate, which allows us to gather initial metrics for each component.
Table 2. Kubernetes resource use
| Service | CPU min | CPU max | CPU avg | Mem min | Mem max | Mem avg |
|---|---|---|---|---|---|---|
| API-svc | 0.38m | 119.6m | 115.93m | 8.0MB | 13.6MB | 12.7MB |
| consumer-svc | 1.37m | 243.45m | 230.49m | 5.4MB | 14.3MB | 11.6MB |
| Kafka | 8.77m | 21.25m | 12.77m | 981.4MB | 983.4MB | 982.7MB |
| PostgreSQL | 1.32m | 19.83m | 11.40m | 105.2MB | 127.4MB | 113.1MB |
| ZooKeeper | 1.06m | 1.40m | 1.18m | 128.0MB | 128.0MB | 128.0MB |
Note: 1000m = 1 full CPU core (Kubernetes CPU abstraction)
This table shows Kubernetes resource use for each service during the test run, including CPU and memory consumption. These metrics help us understand how efficiently each component operates under baseline load.
Table 3. API service metrics
| Metric | Min | Max | Avg |
|---|---|---|---|
go_goroutines | 13 | 21 | 19.71 |
go_sched_gomaxprocs_thread | 1 | 1 | 1 |
go_threads | 5 | 5 | 5 |
go_gc_duration_seconds_count(GC trigger count) | 1303 | ||
process_cpu_seconds_total(seconds) | 106.14 |
Here, we can see internal runtime metrics for the API service, collected from the Go runtime and Prometheus. These metrics show how the service handles concurrency, memory, and CPU use during the test.
Table 4. Consumer service metrics
| Metric | Min | Max | Avg |
|---|---|---|---|
go_goroutines | 31 | 32 | 31.03 |
go_sched_gomaxprocs_thread | 1 | 1 | 1 |
go_threads | 6 | 6 | 6 |
go_gc_duration_seconds_count(GC trigger count) | 341 | ||
process_cpu_seconds_total(seconds) | 106 |
This table shows the same set of Go runtime metrics for the Consumer service, which allows us to compare concurrency behavior and CPU consumption between services.
Table 5. Kafka metrics
| Metric | Min | Max | Avg |
|---|---|---|---|
topic lag | 0 | 4 | 3 |
topic offset | 2700 |
Here, we can see Kafka topic metrics related to message processing. Topic lag shows how well the consumer keeps up with messages, while topic offset indicates total message count during the test.
Table 6. PostgreSQL metrics
| Metric | Min | Max | Avg |
|---|---|---|---|
user active | 1 | 2 | 1.11 |
user idle | 1 | 3 | 1.74 |
This table shows PostgreSQL metrics focused on user activity. These values represent the number of active and idle database connections during the test run.
We can see that the system remains stable under this moderate load. Memory and CPU use are within expected ranges, and database responsiveness is consistent. Kafka maintains minimal lag, indicating effective consumption by the Consumer service.
Test 2. Increased load (Matrix size: 450)
We will conduct the second test with a significantly larger input. In this way, we want to simulate higher computational and memory load across all services. This test helps us uncover hidden bottlenecks and evaluate the system’s ability to scale.
Table 7. Kubernetes resource use
| Service | CPU min | CPU max | CPU avg | Mem min | Mem max | Mem avg |
|---|---|---|---|---|---|---|
| API-svc | 0.03m | 339.84m | 304.07m | 7.2MB | 18.3MB | 15.9MB |
| consumer-svc | 1.03m | 1001.93m | 961.61m | 4.2MB | 59.4MB | 43.6MB |
| Kafka | 0.41m | 15.36m | 10.60m | 88.1MB | 96.1MB | 92.6MB |
| PostgreSQL | 7.14m | 28.09m | 10.02m | 999.8MB | 1004.5MB | 1001.2MB |
| ZooKeeper | 0.87m | 1.24m | 0.94m | 128.0MB | 128.0MB | 128.0MB |
Note: 1000m = 1 full CPU core (Kubernetes CPU abstraction)
Table 8. API service metrics
| Metric | Min | Max | Avg |
|---|---|---|---|
go_goroutines | 13 | 21 | 20.05 |
go_sched_gomaxprocs_thread | 1 | 1 | 1 |
go_threads | 5 | 5 | 5 |
go_gc_duration_seconds_count(GC trigger count) | 2486 |
Table 9. Consumer service metrics
| Metric | Min | Max | Avg |
|---|---|---|---|
go_goroutines | 31 | 33 | 31.97 |
go_sched_gomaxprocs_thread | 1 | 1 | 1 |
go_threads | 6 | 6 | 6 |
go_gc_duration_seconds_count(GC trigger count) | 754 | ||
process_cpu_seconds_total(seconds) | 914 |
Table 10. Kafka metrics
| Metric | Min | Max | Avg |
|---|---|---|---|
topic lag | 0 | 1016 | 876 |
topic offset | 2700 |
Table 11. PostgreSQL metrics
| Metric | Min | Max | Avg |
|---|---|---|---|
user active | 1 | 4 | 2.1 |
user idle | 1 | 2 | 1.03 |
Analysis of results
After comparing the test results, here are our main findings:
- CPU and memory use increase linearly with load, indicating the services respond predictably to increased demand. However, this also exposes areas for optimization, particularly in the Consumer service, which maxes out a full CPU core (1000m) under the heavier load.
- Both the API and Consumer services show a significant increase in
go_gc_duration_seconds_countunder increased load. This indicates effective memory management under pressure, but an excessive number of GC cycles can consume processing time and slow down overall performance.
Tip from Apriorit developers: You can increase the GOGC (Golang GC threshold) from the default 100 to 150–200. This adjustment lets your application use more memory (heap) before triggering garbage collection. As a result, garbage collection runs less frequently, which can improve performance, especially during heavy loads, at the cost of slightly higher memory use.
- Kafka topic lag jumps from an average of 3 to over 870 in the second test. While the Consumer service remains functional, this backlog suggests it struggles to keep up during peak processing periods.
- PostgreSQL shows increased memory use (up to ~1GB), but CPU and connection metrics remain consistent. We didn’t need to reconfigure the DB or Kafka to work under the tested loads.
Overall, the test results reveal that our system performs well under moderate load and generally scales with increased demand. However, high GC frequency and Kafka lag at peak loads suggest we might need targeted optimizations, particularly in memory tuning and Kafka consumer throughput.
We can use the results of load testing to plan and prioritize future improvements to the product’s stability and performance.
Related project
Building a Microservices SaaS Solution for Property Management
Find out how Apriorit helped our client meet growing demand for their SaaS real estate platform by implementing microservices, streamlining deployment pipelines, and boosting system flexibility to meet growth targets.

Conclusion
Load testing plays a critical role in improving the resilience, scalability, and efficiency of microservice-based applications. As your developers simulate real-world scenarios and collect meaningful metrics, they can identify bottlenecks, fine-tune resource allocation, and, ultimately, enhance the user experience.
Effective load testing requires more than just tools. It demands a clear understanding of what to test, which metrics matter, and how to interpret the results. Poorly designed test scenarios can easily obscure the real issues or waste resources without yielding actionable insights.
At Apriorit, we specialize in custom software development and performance optimization, with deep expertise in Golang development. Our experts can help you build a new system or improve an existing one, optimizing your services for real-world use.
Need to boost the performance and reliability of your Golang app?
Let’s talk about how we can support your project with expert engineering and proven development strategies.
Have a question?
Ask our expert!
VP of Engineering


