 Skip to main content

Users always expect an application to work fast and flawlessly. But application speed often depends on query execution times, since almost all applications work with databases. To improve performance, you therefore must optimize SQL queries.
In this article, we explore SQL query optimization best practices, that involve analyzing database query execution time and using this data to improve database performance. We’ll take a look at tools provided by the SQL Server Management Studio (SSMS) and discuss how to use them for SQL Server query optimization.
This article will be helpful for developers who work with Microsoft SQL Server and want to improve query efficiency.
Contents:
Why optimize SQL queries?
Each query in your database can be executed through different algorithms and can be written in different forms and structures. To ensure that users request information from a database in the most efficient way, you need to check whether your system uses the optimal pathways and forms.
Poorly written queries can consume too many system resources, take too long to execute, and potentially cause loss of service for users if a query contains errors.
Query optimization is essential for reducing the system resources required to fulfill a query and allowing the system to handle more queries simultaneously. Thus, you can improve overall system performance and help users get results faster.
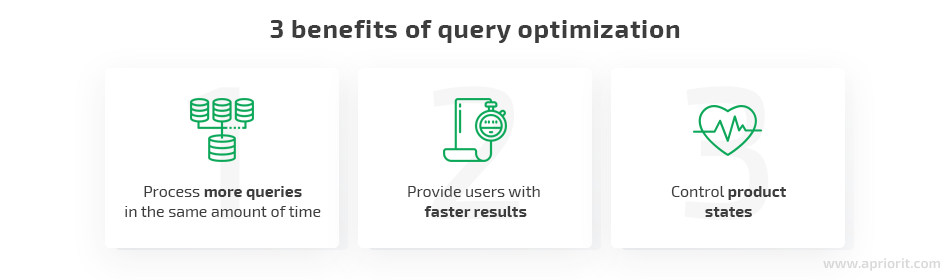
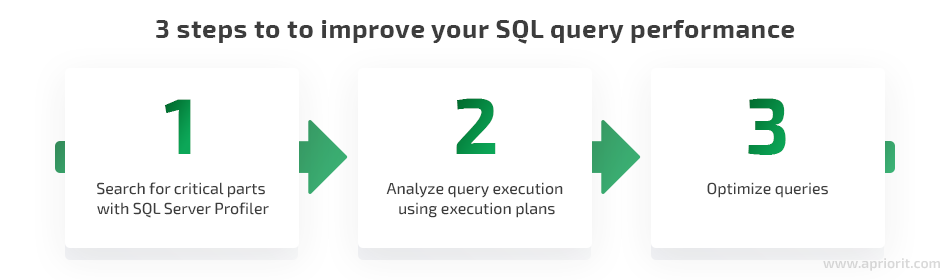
In a nutshell, there are three steps for query optimization in SQL:
- Detect critical parts that need to be improved.
- Analyze problematic query execution to find out which actions cause poor performance.
- Optimize queries by improving query execution plans.
Transform your data management approach with our services
Together, we can unlock the full potential of your data assets and help you achieve your business objectives efficiently.
Step 1. Search for critical parts with SQL Server Profiler
Before you start analyzing and optimizing SQL queries, it’s essential to understand which queries require optimization. To determine this, you can use Microsoft SQL Server query optimization tools like SQL Server Profiler. It helps you trace queries received by the server, see the text of the queries, and check their execution times.
You can run the SQL Server Profiler from the SQL Server Management Studio (SSMS). Just go to Tools > SQL Server Profiler.
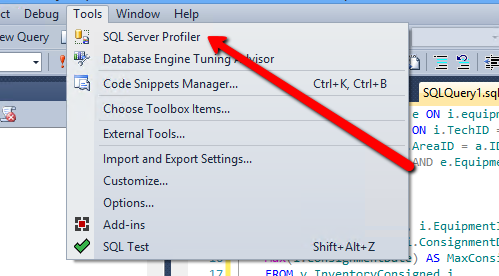
Button to run the SQL Server Profiler
You can set filters to detect the slowest queries by performing the following steps:
- Create a new trace file and go to Events Selection in the Trace Properties tab
- Click the Custom Filters button
- Wait for the Edit Filter window to appear
- Choose Duration from the list on the left
- Configure the required conditions
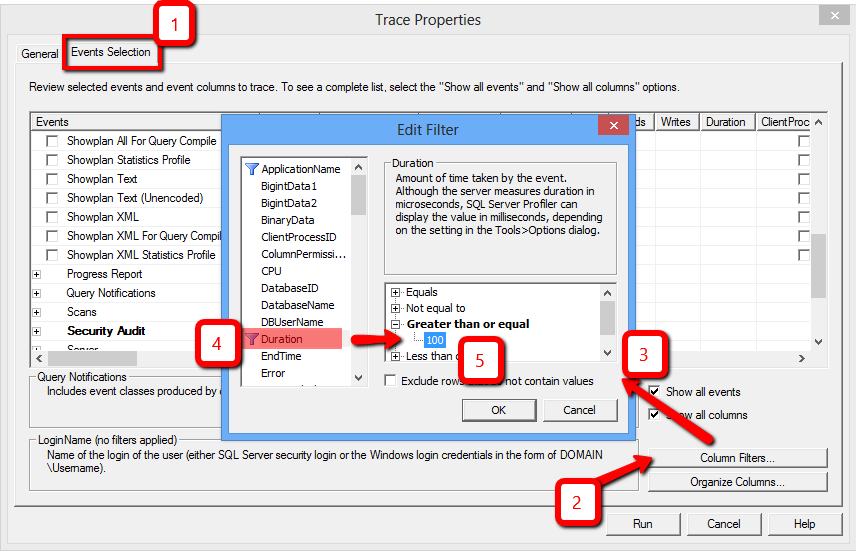
Filtering queries with the longest execution duration in the SQL Server Profiler
Note: Sometimes poor system performance is caused not by executing a few big requests but because of tons of small requests. If filtering queries with the longest execution time doesn’t help, you can remove the filter settings and take a look at the whole picture.
Once you detect the most problematic queries, you can start analyzing how they are executed.
Read also
Data Management Based on SQL Server: On-Premises vs Cloud Database
Can’t decide between managing your data on-premises or in the cloud? Gain insights into cost-efficiency, security, flexibility, and data control to make informed decisions crucial for your software infrastructure.

Step 2. Analyze query execution using execution plans
You can analyze a query using an execution plan, which is also referred to as a query plan. Created by the SQL Server Query Optimizer, an execution plan provides you with information on how a query will be executed, showing you all actions that constitute this query.
A query execution plan contains the following:
- The sequence of accessing each source table
- The methods of extracting data from each table
- The methods used to do calculations on data and to filter, aggregate, and sort data from each table
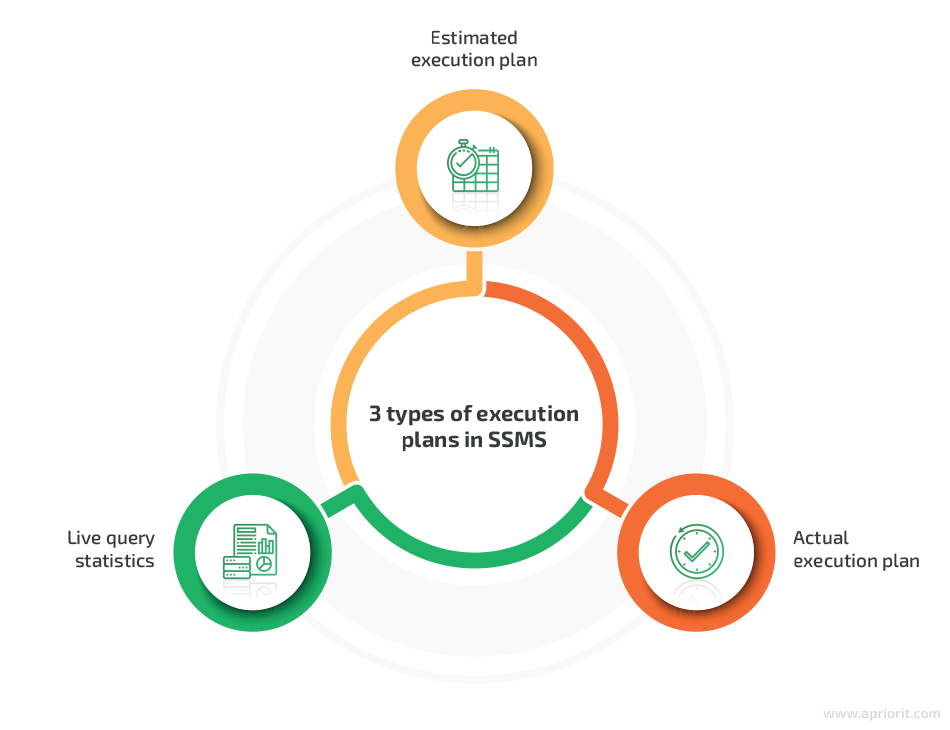
SSMS can display three types of execution plans:
- Estimated execution plan — A compiled plan produced by the query optimizer based on query execution estimates.
- Actual execution plan — A compiled plan with its execution context that includes actual runtime information like execution warnings. It becomes available once query execution is completed.
- Live query statistics — A compiled plan with its execution context that includes runtime information such as the actual number of rows flowing through the operators, elapsed time, and estimated query progress. It’s available for in-flight query executions and is updated every second.
SQL Management Studio provides two ways to view an execution plan: textual and graphical.
You can turn on the text execution plan display by using the SET SHOWPLAN_TEXT ON statement. To see this plan, click the Execute button (i.e. when executing the query).
Say you want to see an execution plan for the following query:
SELECT DISTINCT TOP 100 [PPE].[ID] AS [EmployeeId]
               ,[FI].[ID] AS          [InvoiceId]
               ,[FI].[InvoiceType]
               ,[FI].[SaleDate]
               ,[FI].[Account ID] AS  [CustomerId]
FROM Employee AS PPE
JOIN Invoice AS FI ON PPe.ID = FI.RepIOnce this query is completed, instead of results, you’ll see the execution plan as the sequence of actions performed during query execution:
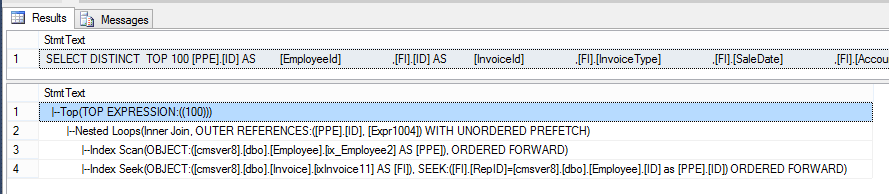
Text execution plan
However, for optimizing SQL queries, it’s much more convenient to use a graphical query execution plan. You can choose this way to view an execution plan for both estimated and actual plans. For the same query, it looks like this:
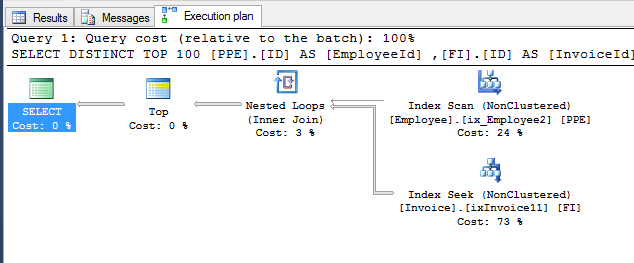
Graphical execution plan
In this example, you can see that selecting data from tables took the most time, while joining data took only 3% of the total execution time.
You can read a graphical query execution plan from right to left and from top to bottom. The icons show you operations that will be performed on data, and the arrows show you the amount of data being processed (a larger arrow means more data).
When analyzing queries, pay attention to the parts that show how data is retrieved from the table and how results from several tables are joined.
There are several basic ways you can extract data from a table:
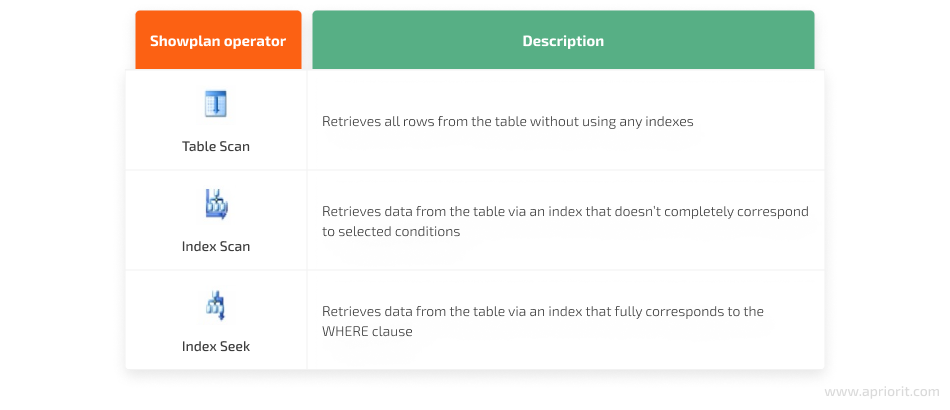
Below are the main ways to join several tables:
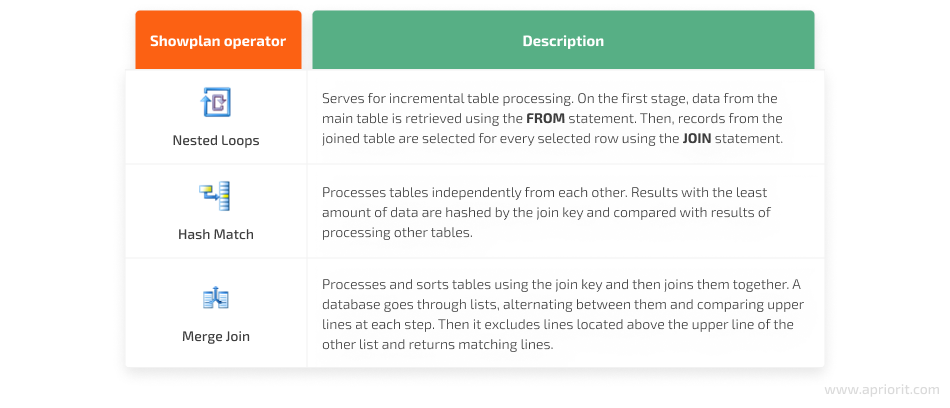
For more information about these and other operators, visit Microsoft’s Showplan Logical and Physical Operators Reference page.
As you can see, a graphical execution plan contains more useful information to optimize SQL queries than does a text plan. It allows you to understand what operations take the most time in relation to the time it takes to execute the entire query.
Moreover, a graphical execution plan provides us with additional information on every object of the tree structure, which can be used in further SQL optimization. To get that information, you need to click on an object or simply hover a mouse over it.
Now let’s take a look at some examples. Here’s the detailed information on Nested Loop joins, which can provide some insights on query execution:
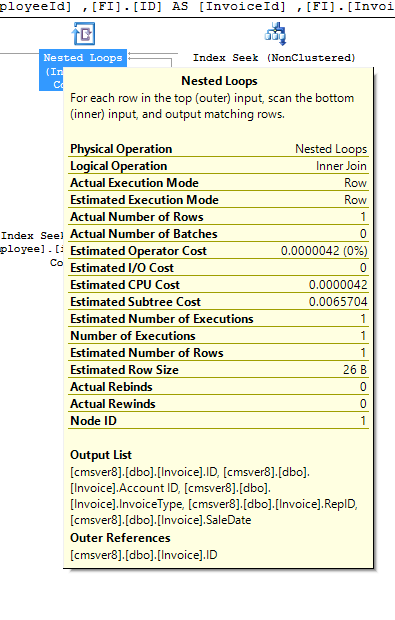
Details of Nested Loop
This next image shows you details of data received from the Invoice table (Index Seek) and transferred further to be joined (by the Nested Loops scheme) with data from the Employee table:
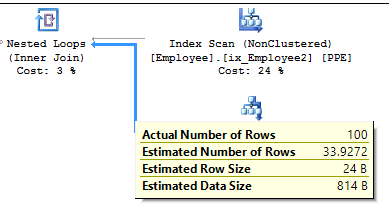
Details of the execution plan
The execution plan can also show you missing indexes that could improve performance and thus optimize the SQL query. It would look like this:
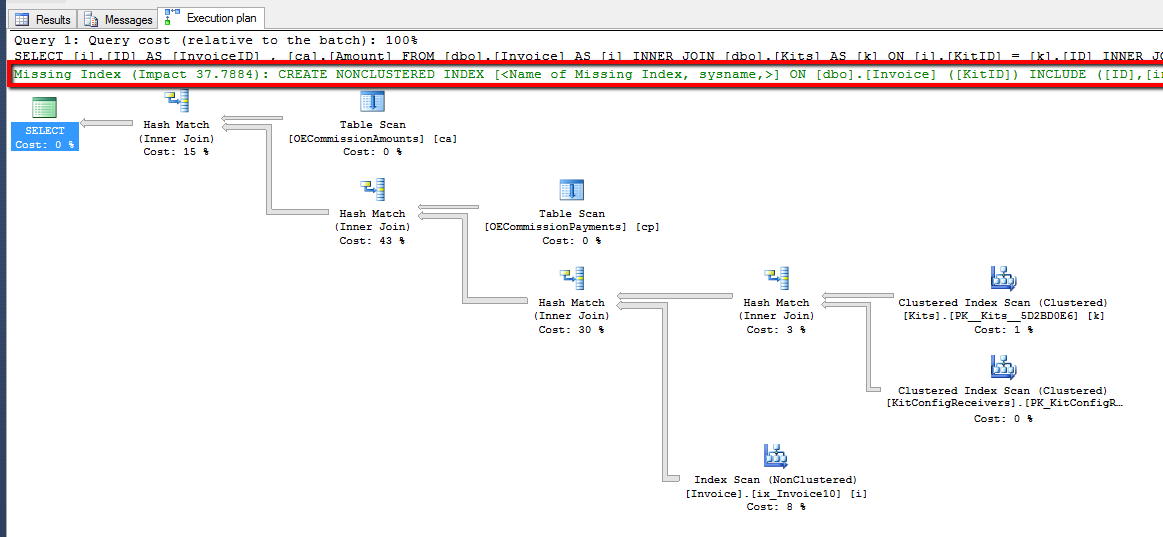
Graphical execution plan of the SQL query
Apart from showing the index that needs to be added, the plan shows what kind of effect you’ll get from adding it. In our case, it estimates that performance will increase by 38%.
Note: The estimate you see isn’t a guarantee that you’ll get this exact percentage of improvement after adding the index. In real life, the actual performance improvement might be significantly less. Also, don’t rush to apply all the indexes suggested by SQL SSMS. Quite often, it suggests indexes that can only slightly improve query performance and only if used with very specific parameters. Keep in mind that extra indexes lead to slower data insertion and editing. Thus, it’s better to use additional indexes only if they can significantly improve query performance.
Once you detect what parts need performance improvements, you can move to the query optimization process. In the next section, we explore how to optimize a query using an execution plan in SQL Server.
Read also
Python Libraries for Database Management: Detailed Overview and Performance Comparison
Discover the benefits of using Python libraries for database management to guide your technology stack decisions.

Step 3. Optimize queries
There are several basic ways to optimize SQL queries:
- Use relevant indexes
- Pay attention to the optimal table joining order
- Leverage hints for the SQL Server Query Optimizer
- Use statistics
Use relevant indexes
You can’t necessarily speed up your query by just using any indexes. Creating more indexes in a table can speed up the reading process, but it will slow down the writing of data to a table. This is why it’s essential to understand what kind of operations are performed with the table.
Also, you have to pay attention to the order of columns when creating a composite index (an index that covers more than one column). But how to determine this order? To do this, you can use index selectivity.
This coefficient shows how many records, as compared to the general number of records, are selected with a condition that uses an indexed column. The fewer records we get, the faster the query will be processed. Therefore, primary keys and unique fields have the best index selectivity coefficients. This is why the clustered index is created for primary keys by default.
But how can we find out which column has the best coefficient?
Say you have the following query and need to understand which column in this script is the most efficient:
SELECT *
FROM [Employee]
WHERE [State] = 'UT' AND [Type] = 'Admin'
AND [expiration date] BETWEEN @beginDate AND @endDate;First, calculate the number of records returned as a result of executing the query with each condition separately. Then, calculate the total number of lines in the Employee table:
SELECT count(*) FROM [Employee] -- 10100 rows SELECT count(*) FROM [Employee] WHERE [State] = 'UT' -- 2896 rows SELECT count(*) FROM [Employee] WHERE [Type] = 'Admin' -- 849 rows SELECT count(*) FROM [Employee] WHERE [expiration date] BETWEEN @beginDate AND @endDate -- 3380 rowsSince the [Type] field has the least number of rows, it is the column with the best index selectivity.
To get the next index column, you need to run the same scripts including the first column:
SELECT count(*) FROM [Employee] WHERE [Type] = 'Admin' AND [State] = 'UT' -- 343 rows SELECT count(*) FROM [Employee] WHERE [Type] = 'Admin' AND [expiration date] BETWEEN @beginDate AND @endDate -- 314 rowsIn this case, there’s no distinct difference between the last two columns, so it doesn’t matter which goes second and which is third.
As a result of this query, you can form the index ([Type], [State], [expiration date]).
Note: this method only works when you have known constants used in query execution. In other cases, selectivity of the column can be quickly evaluated by the purpose of the column, i.e. what type of data it stores. For example, the selectivity of the Age column will be higher than that of the Sex column. Apart from the purpose of the column, you can find out selectivity by analyzing statistics on the column.
When not to use indexes
Apart from knowing the importance of a column order inside the index, it’s also important to know when indexes won’t work. Keep in mind that each time you add an index, we need to scan the whole table. That’s why you don’t need to use indexes when:
1. A function or operation is applied to a column
Indexes aren’t used for a column that’s specified as a function’s argument, as shown in the following example:
SELECT * FROM [Employee] WHERE UPPER([State]) = 'UT' SELECT * FROM [Employee] WHERE ISNULL([IsActive],0) = 1 SELECT * FROM [Employee] WHERE [Salary] + 1000 >= 5000The same goes for type conversion functions like this one:
SELECT * FROM [Employee] WHERE CAST([create date] AS DATE) >= GETDATE(2. The range of values is too wide
If you need to get data from a certain range of values that’s too wide, the optimizer may decide to simply scan the whole table without using any indexes.
To receive data from a wide range of values, use the EQUALS operator (=) for indexed fields. However, you can’t get by with this single operator, so you’ll also need to use operators like BETWEEN, LIKE, <, >, <=, and >= for comparisons. Make sure to set a condition that would minimize the number of results. And when creating a clustered index, it’s also necessary to put the columns with the EQUALS operator first.
Pay attention to the optimal order of joining tables
The order of joining is similar to the order of columns in the index selectivity. It’s best to join tables starting with the one that will produce the least results after filtering. This method is thoroughly described in the book SQL Tuning: Generating Optimal Execution Plans by Dan Tow.
In real life, the query optimizer chooses the optimal order to join tables automatically. You can make it follow the predesigned order with the OPTION (FORCE ORDER) query hint, which we’ll explore in the following section.
Related project
Building a Microservices SaaS Solution for Property Management
Learn how our collaboration with a leading US-based property management software provider transformed their monolithic SaaS platform to a flexible microservices architecture. This transformation helped them to improve add scalability, flexibility, and user experience of their project.

Leverage hints for a query optimizer
Although the query optimizer is fairly independent when it comes to making decisions, there’s still a way to control it. You can use query hints to introduce changes to the execution plan. Let’s check out the two types of commonly used hints: for using indexes and for joining tables.
Hints for using indexes include the following:
- WITH (INDEX<index_name>) shows which index needs to be used while retrieving data from the table.
- WITH (INDEX(0)) prohibits the use of any index for a table, i.e. the full table scan will be performed to get results. If there’s a clustered index, the index scan will be performed. This hint can be useful when you need to check the usefulness of adding a certain index.
And here are major hints for joining tables together:
LOOPandHASHmake an optimizer merge tables using Nested Loops or Hash Match methods. If at least one of these hints is present in the script, use of theOPTION (FORCE ORDER)hint is also assumed.OPTION (LOOP/HASH JOIN)shows that the Nested Loops ог Hash Match method should be used for all table joins.OPTION (FORCE ORDER)shows that tables have to be joined in the order in which they are listed in the query.OPTION (FAST 1)shows the optimizer that it’s necessary to display beginning lines as fast as possible, which automatically enables theOPTION (LOOP JOIN)hint. In addition, if there’sORDER BYclause sorting in your query, then execution of this hint becomes meaningless. The reason is thatFAST 1is supposed to retrieve the first relevant line as fast as possible, but theORDER BYclause, in this case, will provide no choices.
You can find more information and examples about the OPTION clause on Microsoft’s OPTION Clause page.
Use statistics
The SQL Server Query Optimizer uses statistics to create execution plans. Statistics for SQL query optimization are objects with statistical information regarding the distribution of values inside an indexed view or table columns. If statistics are formed for an index or table, then the query optimizer can find the optimal execution plan faster. You can form your own statistics or edit existing ones to help the optimizer.
However, execution plans and statistics based on large and small volumes can be considerably different. It’s necessary to check the work of your queries on a big database to make sure they will work correctly on production.
Test data can’t provide the same precision that real data can, however. Also, it’s not always possible to get a copy of a real-life database. If you can’t, you can get statistics from the real database and load the data you found to a test database. This way, the query optimizer will think that it’s working with large amounts of data and will create execution plans accordingly.
Conclusion
In this article, we’ve discussed basic techniques and SQL query optimization tips. As you can see, the Microsoft SQL Server provides enough tools to analyze query performance and tune up SQL scripts. The most important thing is to learn the rules on how to use them and to understand the nuances of working with main database objects such as tables and indexes.
Streamline your data operations and enhance efficiency with Apriorit
Reach out to start creating an effective solution from scratch or improving your existing software and data systems.
References
SQL Server Profiler:
- SQL Server Profiler, Microsoft documentation
- View and Analyze Traces with SQL Server Profiler, Microsoft documentation
Helpful sources for working with execution plans:
- Showplan Logical and Physical Operators Reference, Microsoft documentation
- Displaying Graphical Execution Plans (SQL Server Management Studio), Microsoft documentation
- Improving SQL Server Performance, Microsoft documentation
SQL Query optimization:
- SQL Tuning: Generating Optimal Execution Plans, 1st Edition, Dan Tow
- SQL Query Tuning for SQL Server. Getting It Right the First Time [PDF], Dean Richards
- SQL Server Index Architecture and Design Guide, Microsoft documentation
- Statistics, Microsoft documentation
Have a question?
Ask our expert!
Program Manager


