 Skip to main content

DevOps tools help engineers automate actions between the development team and the operations team to reliably create, test, and deploy software. However, choosing the right automation tools for DevOps isn’t easy.
Among the factors you need to keep in mind are the needs of your project, your expertise, the operating model and tool architecture, usability, support, and other technical and business particularities.
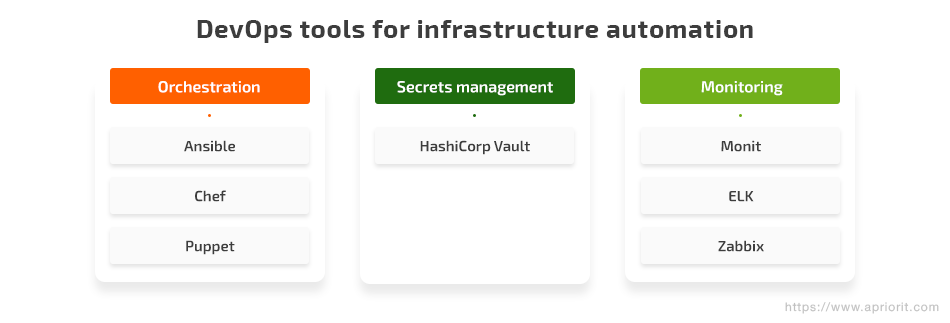
In this article, we focus on three main tasks you’ll need to perform when automating your IT infrastructure: configuration management and orchestration, secrets management, and infrastructure monitoring. We also review seven popular DevOps tools for infrastructure automation – Ansible, Chef, Puppet, HashiCorp Vault, Monit, ELK, and Zabbix – to make it easier for you to decide which fits your needs.
Contents:
What are the benefits of infrastructure automation?
Let’s start by figuring out what infrastructure automation is and why you may need it.
Infrastructure automation, otherwise known as configuration management or scripted infrastructure, is the process of describing the configuration of your infrastructure as a script. You can create a single configuration for different processes, such as installing an operating system or managing communications between software and instances, and apply this configuration to multiple nodes.
There are two main reasons to automate the management of cloud infrastructure:
- Save time on routine tasks. System administrators, IT professionals, and DevOps engineers need to automate as many routine tasks as possible so they have time for solving critical issues.
- Ease the management of complex environments. Automation makes it possible to manage complex, diverse environments, and provides for fast scaling.
DevOps automation tools can help you get the most out of the infrastructure automation process. However, there isn’t one universal tool that can answer all your prayers. There are a wide variety of DevOps tools you can use to automate your infrastructure. In this article, we look at some popular tools for three key DevOps tasks:
- Orchestration
- Secrets management
- Monitoring
Now it’s time to take a closer look at each of these tasks. Let’s start with infrastructure orchestration.
Choosing infrastructure orchestration tools
Similarly to infrastructure automation, orchestration makes it easier for DevOps specialists to manage routine, day-to-day tasks and focus on more important tasks instead. The main difference is that while infrastructure automation is more about individual tasks, orchestration focuses on optimizing and standardizing individual processes. In particular, orchestration is used to automate the configuration, coordination, and management of software and computer systems.
Orchestration usually involves script-based tools for deploying and connecting an application. Many orchestration tools can be used to write infrastructure as code (IaC), allowing you to manage your operations environment like any other piece of code.
Below, we look briefly at three popular orchestration tools used by DevOps professionals: Ansible, Chef, and Puppet. Let’s start with Ansible.
Ansible
Ansible is not only an orchestration tool but an agentless configuration management tool. The configuration modules in Ansible are called playbooks and are written in YAML format. There’s even a library of community playbooks for you to use as templates.
Using this IaC tool, you can integrate and automate development, testing, deployment, and performance management. All you need to do is describe the way the system and its components interact; the rest will be handled by Ansible.
Ansible has two main advantages:
- It helps you get rid of unnecessary repetition
- It reduces the complexity of your infrastructure
It also has a number of additional benefits:
- It can be modulated for multi-tier deployments
- It uses a rather simple language
- Functions can be expanded and integrated
- You can encrypt your scripts and passwords with Ansible-Vault
- No special coding skills are required
Finally, Ansible works with SSH and doesn’t require agents, eliminating the need for additional configurations on the client’s side.
Chef
Chef is one of the most popular cloud infrastructure automation tools for configuration management. It uses a Ruby domain-specific language (DSL).
The key differentiator of this tool is its cookbooks — units for configuration distribution. In cookbooks, you code your infrastructure and define configuration scenarios in the DSL. But in contrast to Ansible, you’ll also need a bit of programming knowledge to work with Chef.
Chef is an agent-based provisioning tool that can provide you with virtual machines (VMs). It uses agents to configure VMs and servers according to the rules defined in cookbooks. To do this, you’ll need an agent running on every server that needs to be configured.
Chef has two main advantages:
- Consistent configuration — You can easily maintain a consistent configuration even when you need to adapt your infrastructure to the rapid growth of your application.
- Infrastructure as code — You can describe your infrastructure in code and automate its management.
Here are some of the most useful things Chef does:
- Turns infrastructure into code
- Reduces operating costs
- Offers flexible, testable, customizable, and readable configuration policies
- Helps you effectively manage data centers
- Manages multiple cloud environments
- Automates configurations and makes them testable
- Provides consistent configurations across all environments
- Allows you to customize code according to your requirements
- Supports simple migration
- Supports multiple platforms such as FreeBSD and AIX
Additionally, while you can create personal recipes and cookbooks, Chef also provides you with a rich selection of ready-to-use templates.
But perhaps the best part of Chef is that configurations are only changed when the system deviates from the desired state. In properly configured systems, no actions are taken.
Puppet
Just like Chef, Puppet is a Ruby-based tool for managing infrastructure configurations. It’s also an agent-based solution, with a Puppet agent running on all servers that need to be configured. The agent pulls a compiled module with specifications on required software from the master server and installs that software on all servers.
However, Puppet doesn’t run any code or scripts on your infrastructure. Instead, it builds a graph that shows what the code base of your infrastructure should look like. Then it recreates the model shown in that graph.
In other words, all you need to define is the end state of your infrastructure and Puppet will figure out the best way to reach that desired state.
The key advantages of Puppet are:
- Fast deployment
- Infrastructure as code
Key features of Puppet:
- Defines and manages infrastructure as code
- Uses the same tools that developers use to manage software
- Ensures continuous collaboration of operations, development, and QA teams
- Improves software quality
- Reduces downtime
- Offers a variety of ready-to-use modules for seamless automation
- Takes a task-based approach
- Allows for complete infrastructure automation
- Provides contextual reporting in real time
- Enables continuous detection and resolution of conflicts
Puppet was designed to quickly inspect, manage, and maintain infrastructure, so it can deploy changes within mere hours. Plus, it can fix any abnormalities that make your system deviate from the desired state.
Ansible, Chef, and Puppet are the three most popular tools DevOps professionals use for managing infrastructure configurations. In the next section, we talk about the importance of secrets management in DevOps and the tool that works best for keeping your sensitive data safe: HashiCorp Vault.
Protecting sensitive data with secrets management
Every application uses multiple kinds of sensitive data: passwords, API keys, secure tokens, and so on. All this data falls into the category of secrets and requires special attention from DevOps specialists.
Secrets are the type of data that should be easy for everyone to access. You shouldn’t keep secrets along with non-sensitive data and store them in plain text. This is why all configuration management systems face the problem of ensuring secure secret storage.
But why are secrets so important?
Secrets are what help you restrict access to sensitive, critical data used by your application. The problem is that developers often choose the fastest and simplest ways to store and manage secrets, which aren’t always as secure as they should be.
For instance, you can see PEM files, SSH keys, and other configuration secrets stored in shared spaces and transferred over unencrypted communication channels. While simplifying the process of secrets management, such practices significantly increase the risk of sensitive data being compromised, as anyone with access to the shared space can get a hold of these secrets.
Below, we take a closer look at a popular and efficient tool for secrets management: HashiCorp Vault.
HashiCorp Vault
HashiCorp Vault is a service for managing secrets. It provides an API that gives access to secrets based on policies. Any user of the API must be authenticated and can only see the secrets they are authorized to see.
Vault uses the 256-bit Advanced Encryption Standard (AES) and Galois/Counter Mode (GCM) to encrypt sensitive data. It can store secrets in various backends such as Amazon DynamoDB, HashiCorp Consul, and etcd. It also provides other backends that allow you to create credentials for MySQL, SQL Server, and PostgreSQL databases.
Vault never stores secrets in a persistent location, reducing the risk of data compromise. Furthermore, in order to start or restart Vault, one or more operators are required to unseal it first. Authorized access is required for any operations with secrets.
For authenticating users at the transport level, Vault uses tokens. Each token is assigned to a policy that can limit actions and paths. Policies use path-based matching to enforce rules. Tokens can receive metadata (key values) and display names, which makes administration more convenient for users.
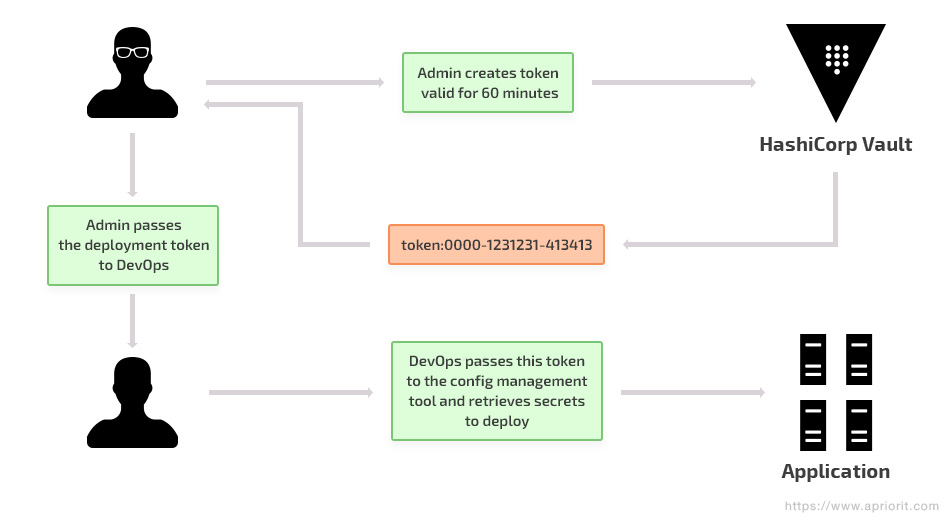
Figure 1. Creation and use of tokens in HashiCorp Vault
You can create tokens manually and assign them to applications and users. In addition, there are several authentication mechanisms – Lightweight Directory Access Protocol (LDAP), username/password, and GitHub Token – that allow users to log in and receive a token.
Tokens and authentication mechanisms can be revoked, which makes it easy to block a specific user.
For example, here’s what the LDAP authentication model looks like:
Figure 2. The LDAP authentication model
- The user attempts to authenticate in Vault using their LDAP credentials (username and password).
- Vault establishes a connection to LDAP and asks the LDAP server to verify the credentials. Assuming verification is successful, the LDAP server returns user information, including organizational unit groups.
- Vault maps the result from the LDAP server to Vault internal policies, using the mapping configured by the security group in the previous section. Vault then generates a token and attaches the appropriate policies to it.
- Vault returns the token to the user. This token now has appropriate policies that were assigned according to the mapping configuration that was previously configured by the security group.
Now, the user can use this Vault token for future operations. If the user performs the authentication steps again, they will receive a new token. It will have the same permissions, but the token itself will be different. Also, authenticating for a second time doesn’t make the original token invalid.
In addition to HashiCorp Vault, DevOps professionals sometimes use such tools as HashiCorp Consul and etcd for securely storing secrets and keys.
In the next section, we move to the problem of infrastructure monitoring and take a brief look at some popular tools that can help you with it.
Selecting an infrastructure monitoring solution
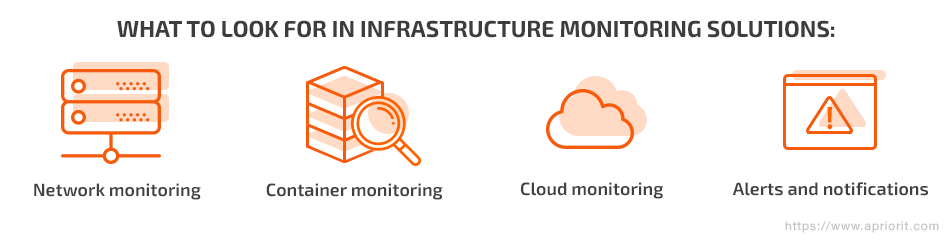
For any DevOps specialist, it’s important to be able to monitor your infrastructure so you can easily tell who did what and when. In general, there are four main areas that a good monitoring solution or toolset should cover:
- Network monitoring
- Container monitoring
- Cloud monitoring
- Alerts and notifications
Let’s look closer at each of these tasks.
Network monitoring tools should provide you with a number of performance indicators: bandwidth, latency, response speed, various port-level metrics, network packet flow, CPU use by hosts. It’s preferable if these tools provide custom metrics and aggregate these metrics.
Container and microservices monitoring tools should focus on capturing states at the container level for CPU, memory, network, and disk usage, as well as processes running inside containers.
Cloud monitoring tools are often provided by cloud vendors. Using these tools, you should be able to monitor workloads running in your cloud environment and log everything that happens in this environment. Some cloud service providers also offer performance metrics and network-level metrics, comprehensive visibility of application components, measurements of microservices and PaaS services, and storage and analysis of data received from other monitoring tools.
Alerts and notifications that can be set for predefined rules are mandatory for any monitoring tool. Look for a solution that allows you to send email notifications and webhooks, can be integrated into collaboration tools or ChatOps such as Slack or Telegram, allows you to define user thresholds, and notifies you when these thresholds are exceeded.
Below, we provide a brief overview of three popular infrastructure monitoring tools: Monit, ELK, and Zabbix.
Monit
Monit is an open-source tool for managing and monitoring Unix systems as well as various cloud services, databases, and even remote hosts, server protocols, and TCP/IP ports.
The goal of Monit is to ensure that any given process on the machine is up and running properly. If any monitored service goes down, Monit will fix detected errors and repair it. For instance, if Apache crashes, Monit will restart the Apache process.
Monit logs all information about the system state and registered errors. Also, you can configure Monit to send notifications on critical errors, recovery statuses, and restarts of services and critical processes.
This tool is easy to configure and is especially useful for multi-service architectures with hundreds of microservices.
ELK Stack
The ELK Stack, otherwise known as the Elastic Stack, is a set of three open-source DevOps tools: Elasticsearch, Logstash, and Kibana. This toolset collects logs from all services, applications, networks, tools, servers, and other elements of the environment in a centralized place for further processing and analysis.
Here are some of the important features of the ELK Stack:
- Lightweight and easy to deploy
- Supports all data formats
- Allows you to search logs in real time
There are two ways you can use this tool.
First, you can use the ELK Stack for analytical purposes. It comes in handy for tasks including troubleshooting and service monitoring. The ELK Stack also can help you reduce the time needed to solve different operational problems.
Secondly, you can use it for security and auditing purposes – for instance, to monitor changes in security groups or access permissions. By receiving alerts on such changes, you can easily detect and handle unauthorized users and actions.
Zabbix
Zabbix is an open-source monitoring tool that helps you keep an eye on different types of IT infrastructure components including networks, servers, cloud services, and virtual machines. It provides a rich selection of metrics such as network, disk, and CPU use.
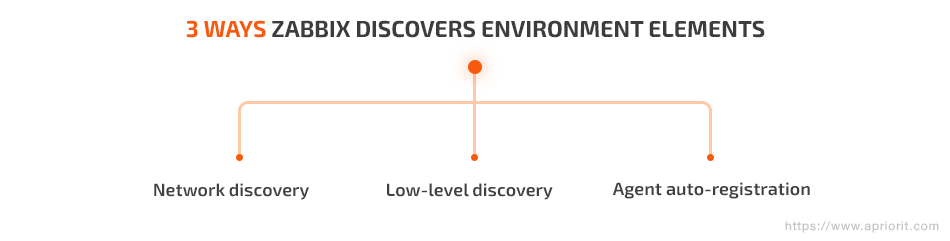
Most importantly, Zabbix automates the discovery and management of different IT infrastructure elements. There are three main functions for automatic discovery and management of environment elements in Zabbix:
- Network discovery
- Low-level discovery
- Agent auto-registration
Let’s take a closer look at each of these approaches.
With network discovery, you can periodically scan your network for passive Zabbix agents and external services. This function also allows you to take predefined actions once such a service or agent is detected. The list of possible actions includes sending notifications to a user, executing remote scripts, and enabling or disabling a host.
Low-level discovery allows you to automatically create elements, triggers, and graphs based on the detected device. Low-level discovery can create metrics from SNMP object identifiers, Windows services, Open Database Connectivity (ODBC) structured query language (SQL) queries, network interfaces, and more.
Finally, auto-registration of active agents allows you to automatically monitor new equipment if it has an active Zabbix agent installed.
Zabbix also has a number of helpful features. For instance, using Zabbix distributed monitoring, remote scripts collect data from several devices in distributed locations and gather all this data in a single panel or report – for example, about server availability across the country.
Also, you can configure Zabbix to send notifications via email or instant messenger based on predefined events.
Conclusion
Infrastructure automation is one of the most important tasks that DevOps professionals face today. When organized properly, it may help you reduce the time spent on repetitive tasks, save time for handling critical issues, and improve the security and overall performance of your infrastructure.
In this article, we described the three most important challenges to be solved when automating IT infrastructure: orchestration, secrets management, and monitoring. We also named some of the most popular tools for each of these tasks.
These tools have their advantages, but none is a silver bullet for every DevOps team. The final choice will always depend on the specific needs of your specific project.
At Apriorit, we widely implement DevOps tools to automate repetitive processes and tasks and monitor resource use. Get in touch with us and our experts will gladly assist you in implementing a DevOps approach to developing, deploying, and maintaining your software solutions.
Have a question?
Ask our expert!
VP of Innovation and Technology, Canada Branch Director


